

Deforestation alert analysis#
Retrieve any type of alert on a selected AOI
Note
To use this module, you must register to the NICFI – Planet Lab programme and link your account to Google Earth Engine (GEE) (see Use NICFI–PlanetLab data).
Set up#
In the SEPAL Apps dashboard (the purple on the left side), select Deforestation alert analysis.
Note
The launching process can take several minutes.
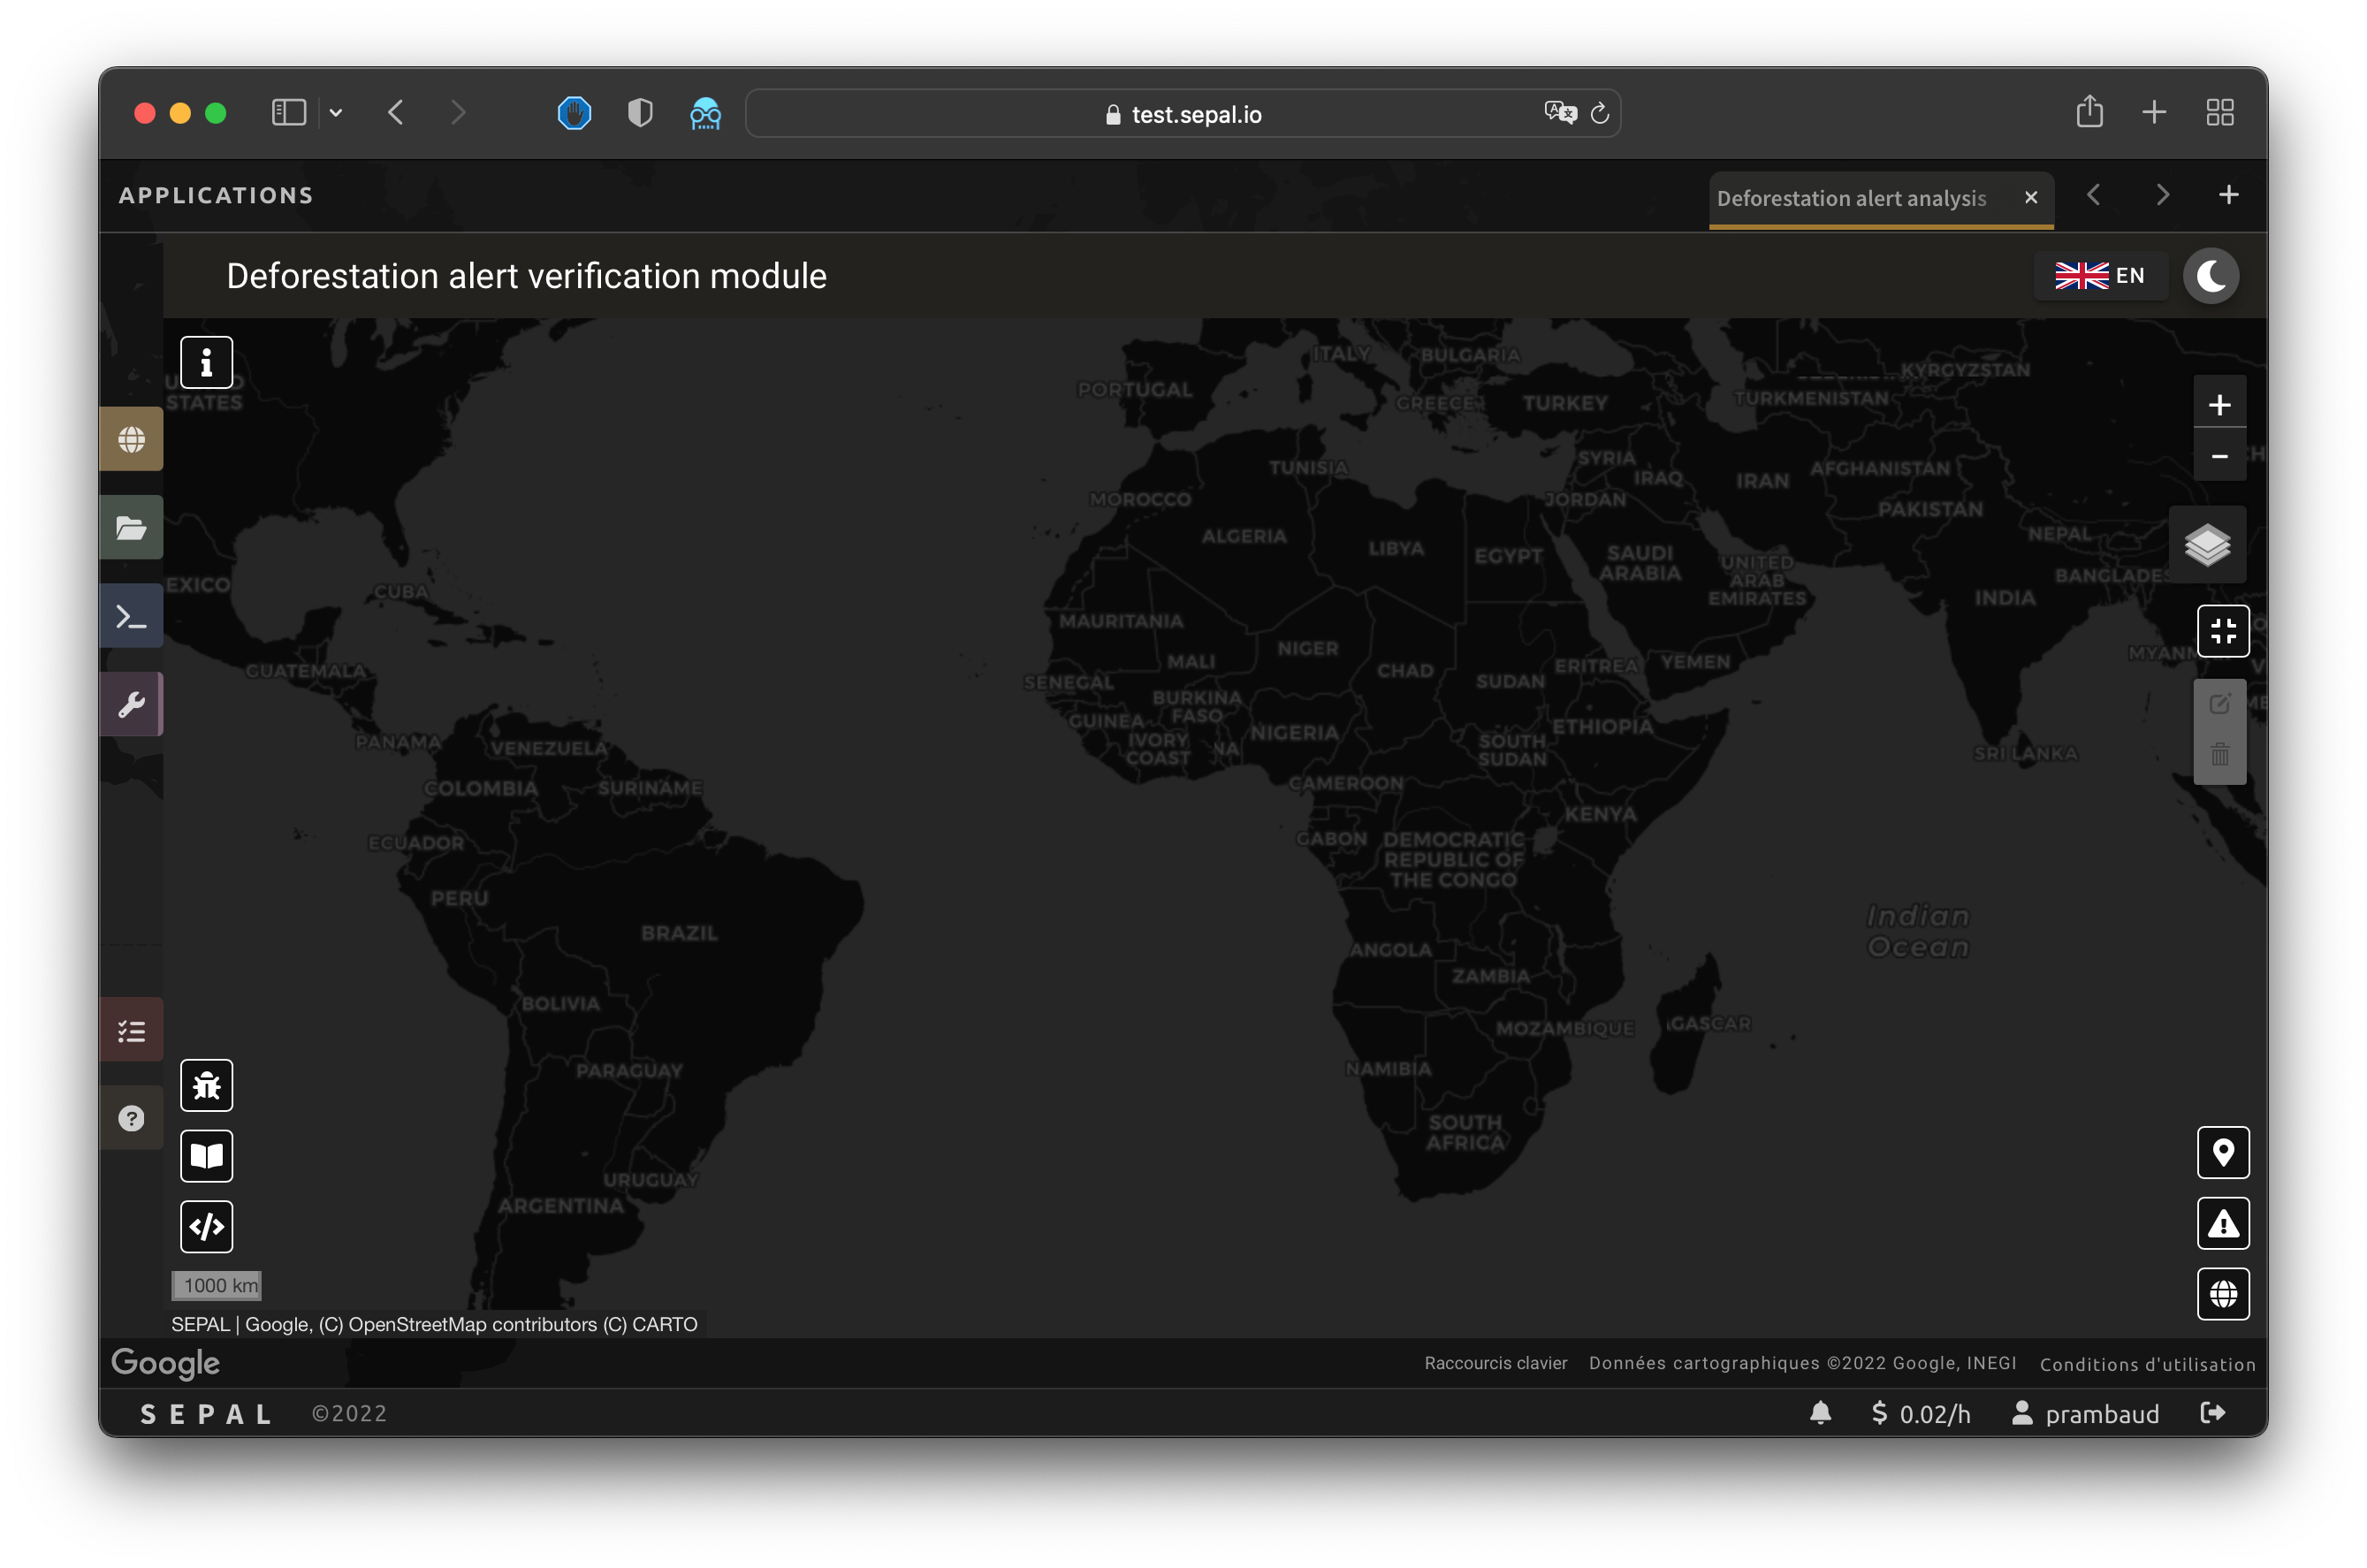
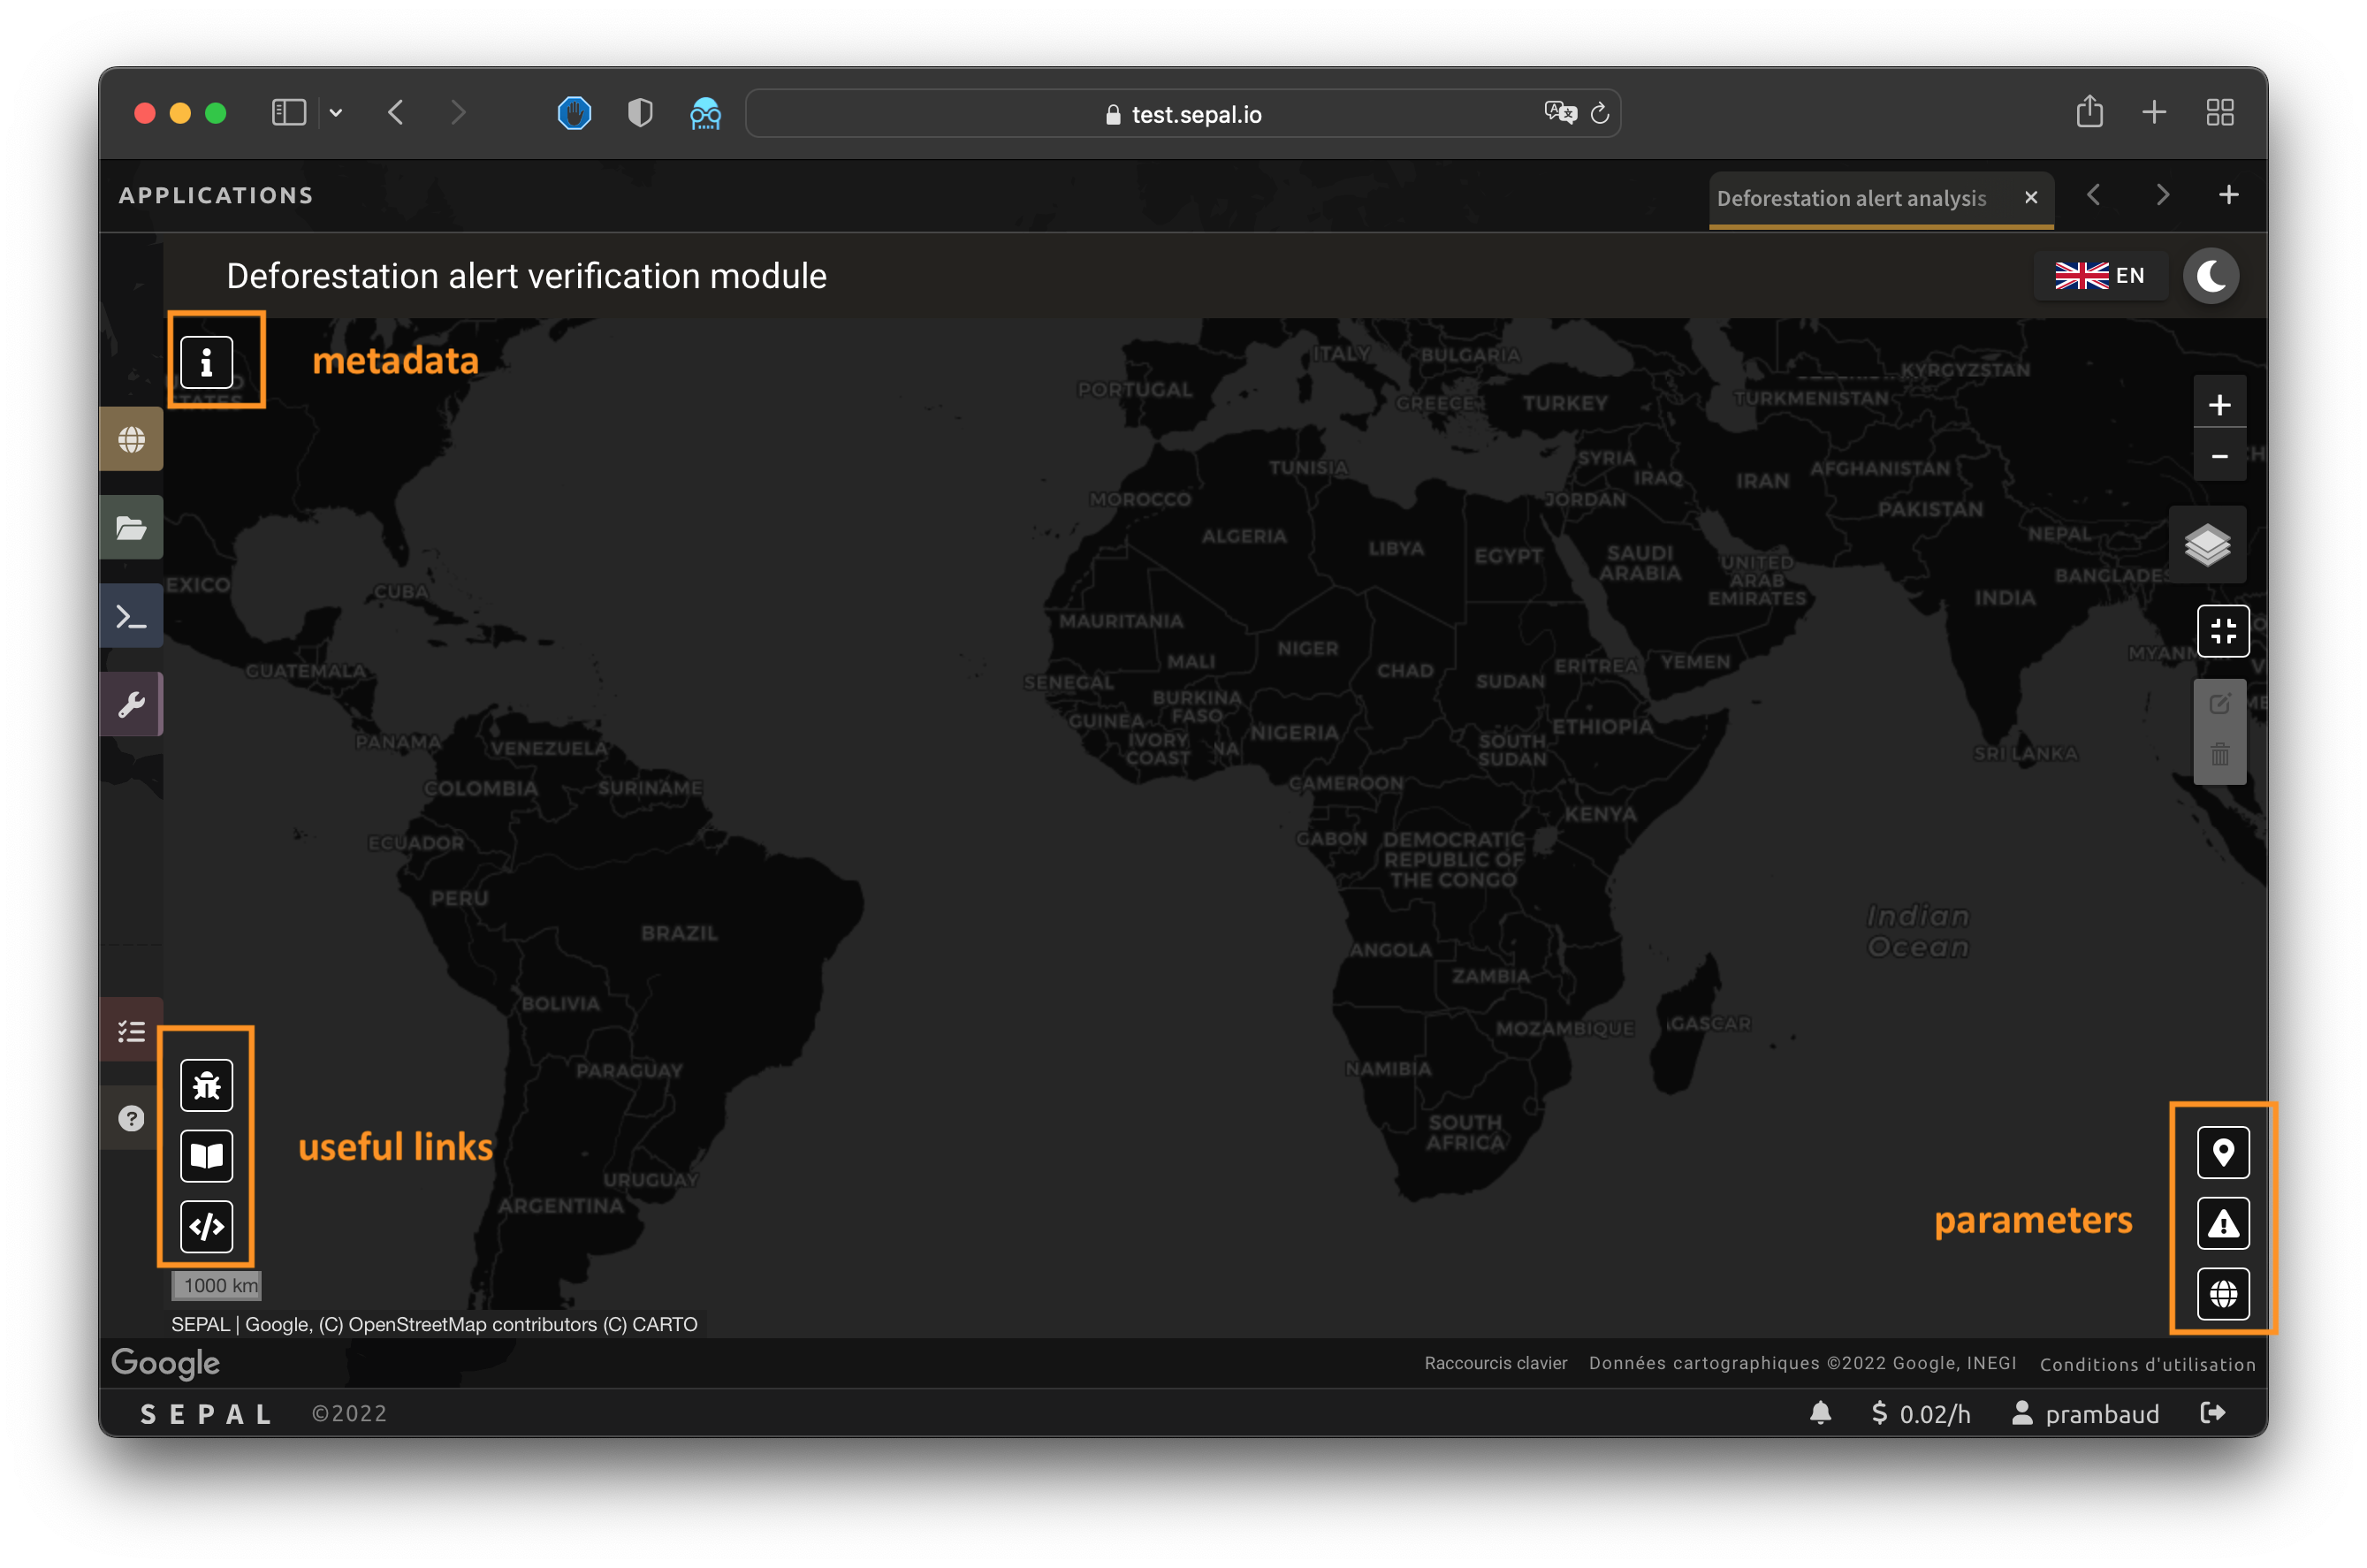
The application should launch, displaying a map of the world. In the lower left, there are three buttons:
: the link to the module’s documentation;
: the link to open a new issue in the GitHub repository; and
: the link to the source code of the application.
The links will open in a new webpage.
In the lower-right corner of the map, there are three buttons for navigating through the different widgets of the application:
: the widget to select the area of interest (AOI);
: the widget to select and filter alerts; and
: the widget to select Planet parameters.
In the upper-left corner, there is the button to open the metadata interface, which will be explained in this article.
Parameters#
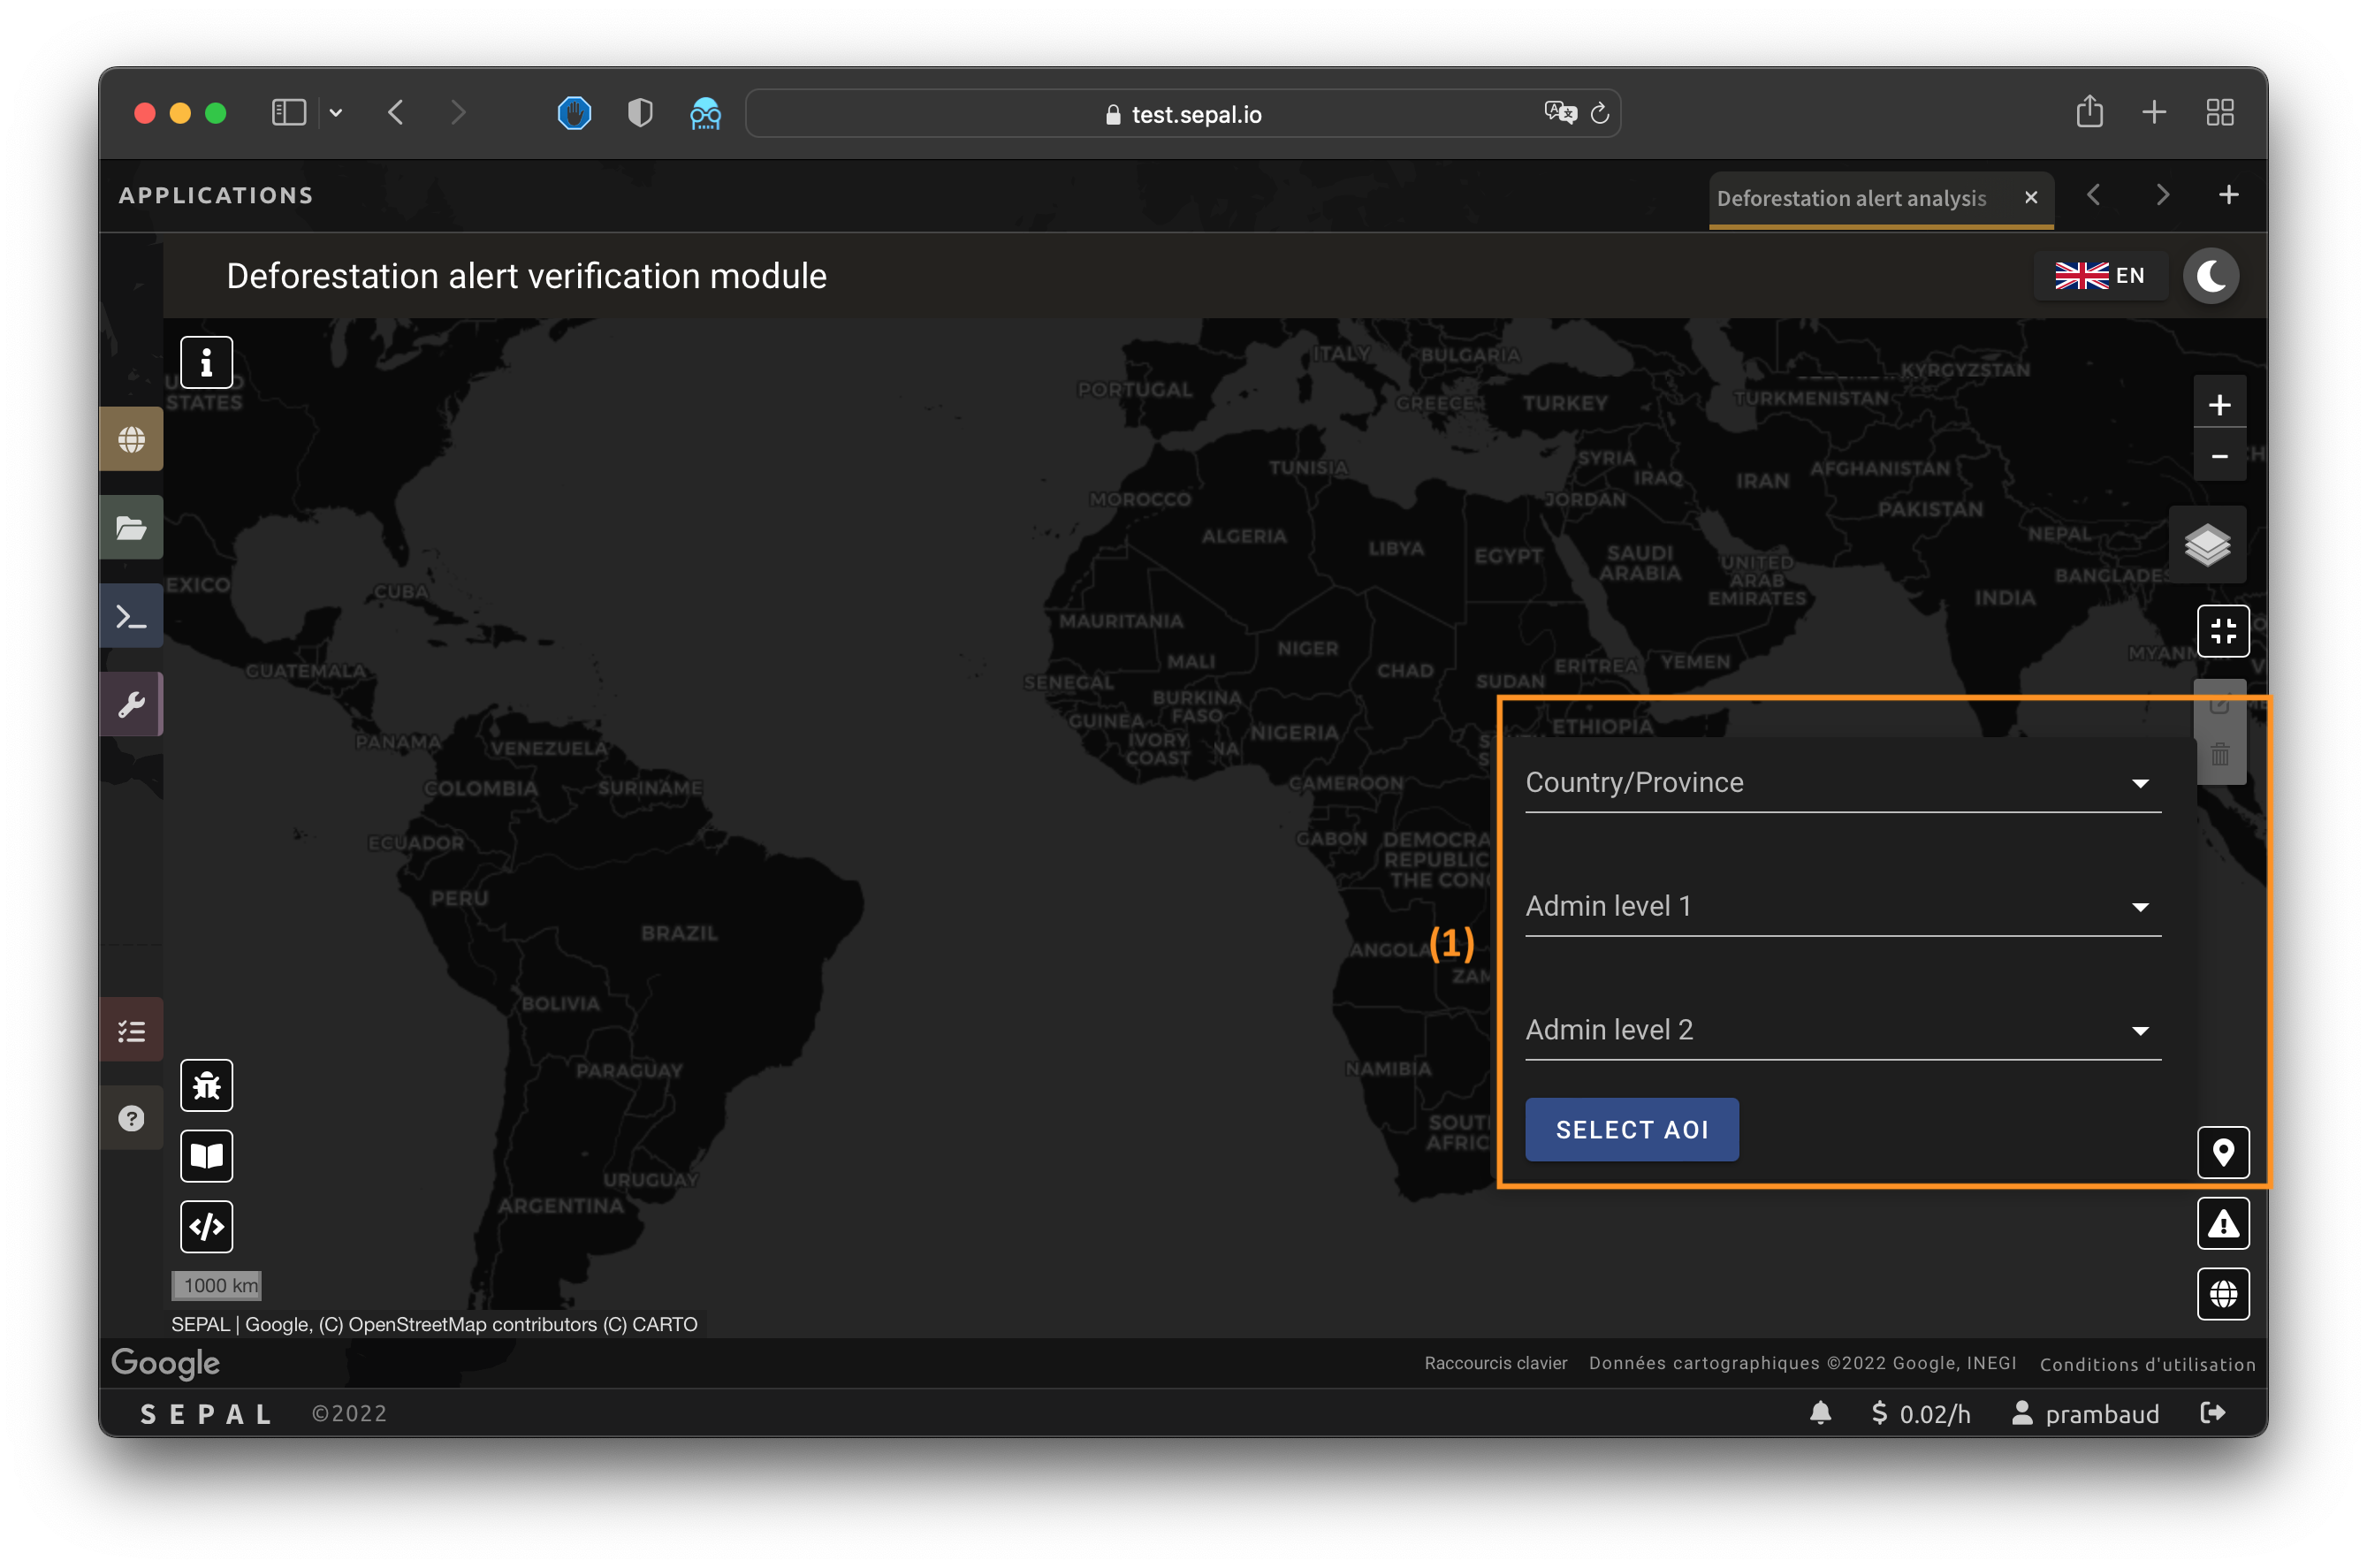
The settings need to be fully validated to load the alerts on the map. There are three sections:
AOI
Alert
Planet (optional)
Area of interest#
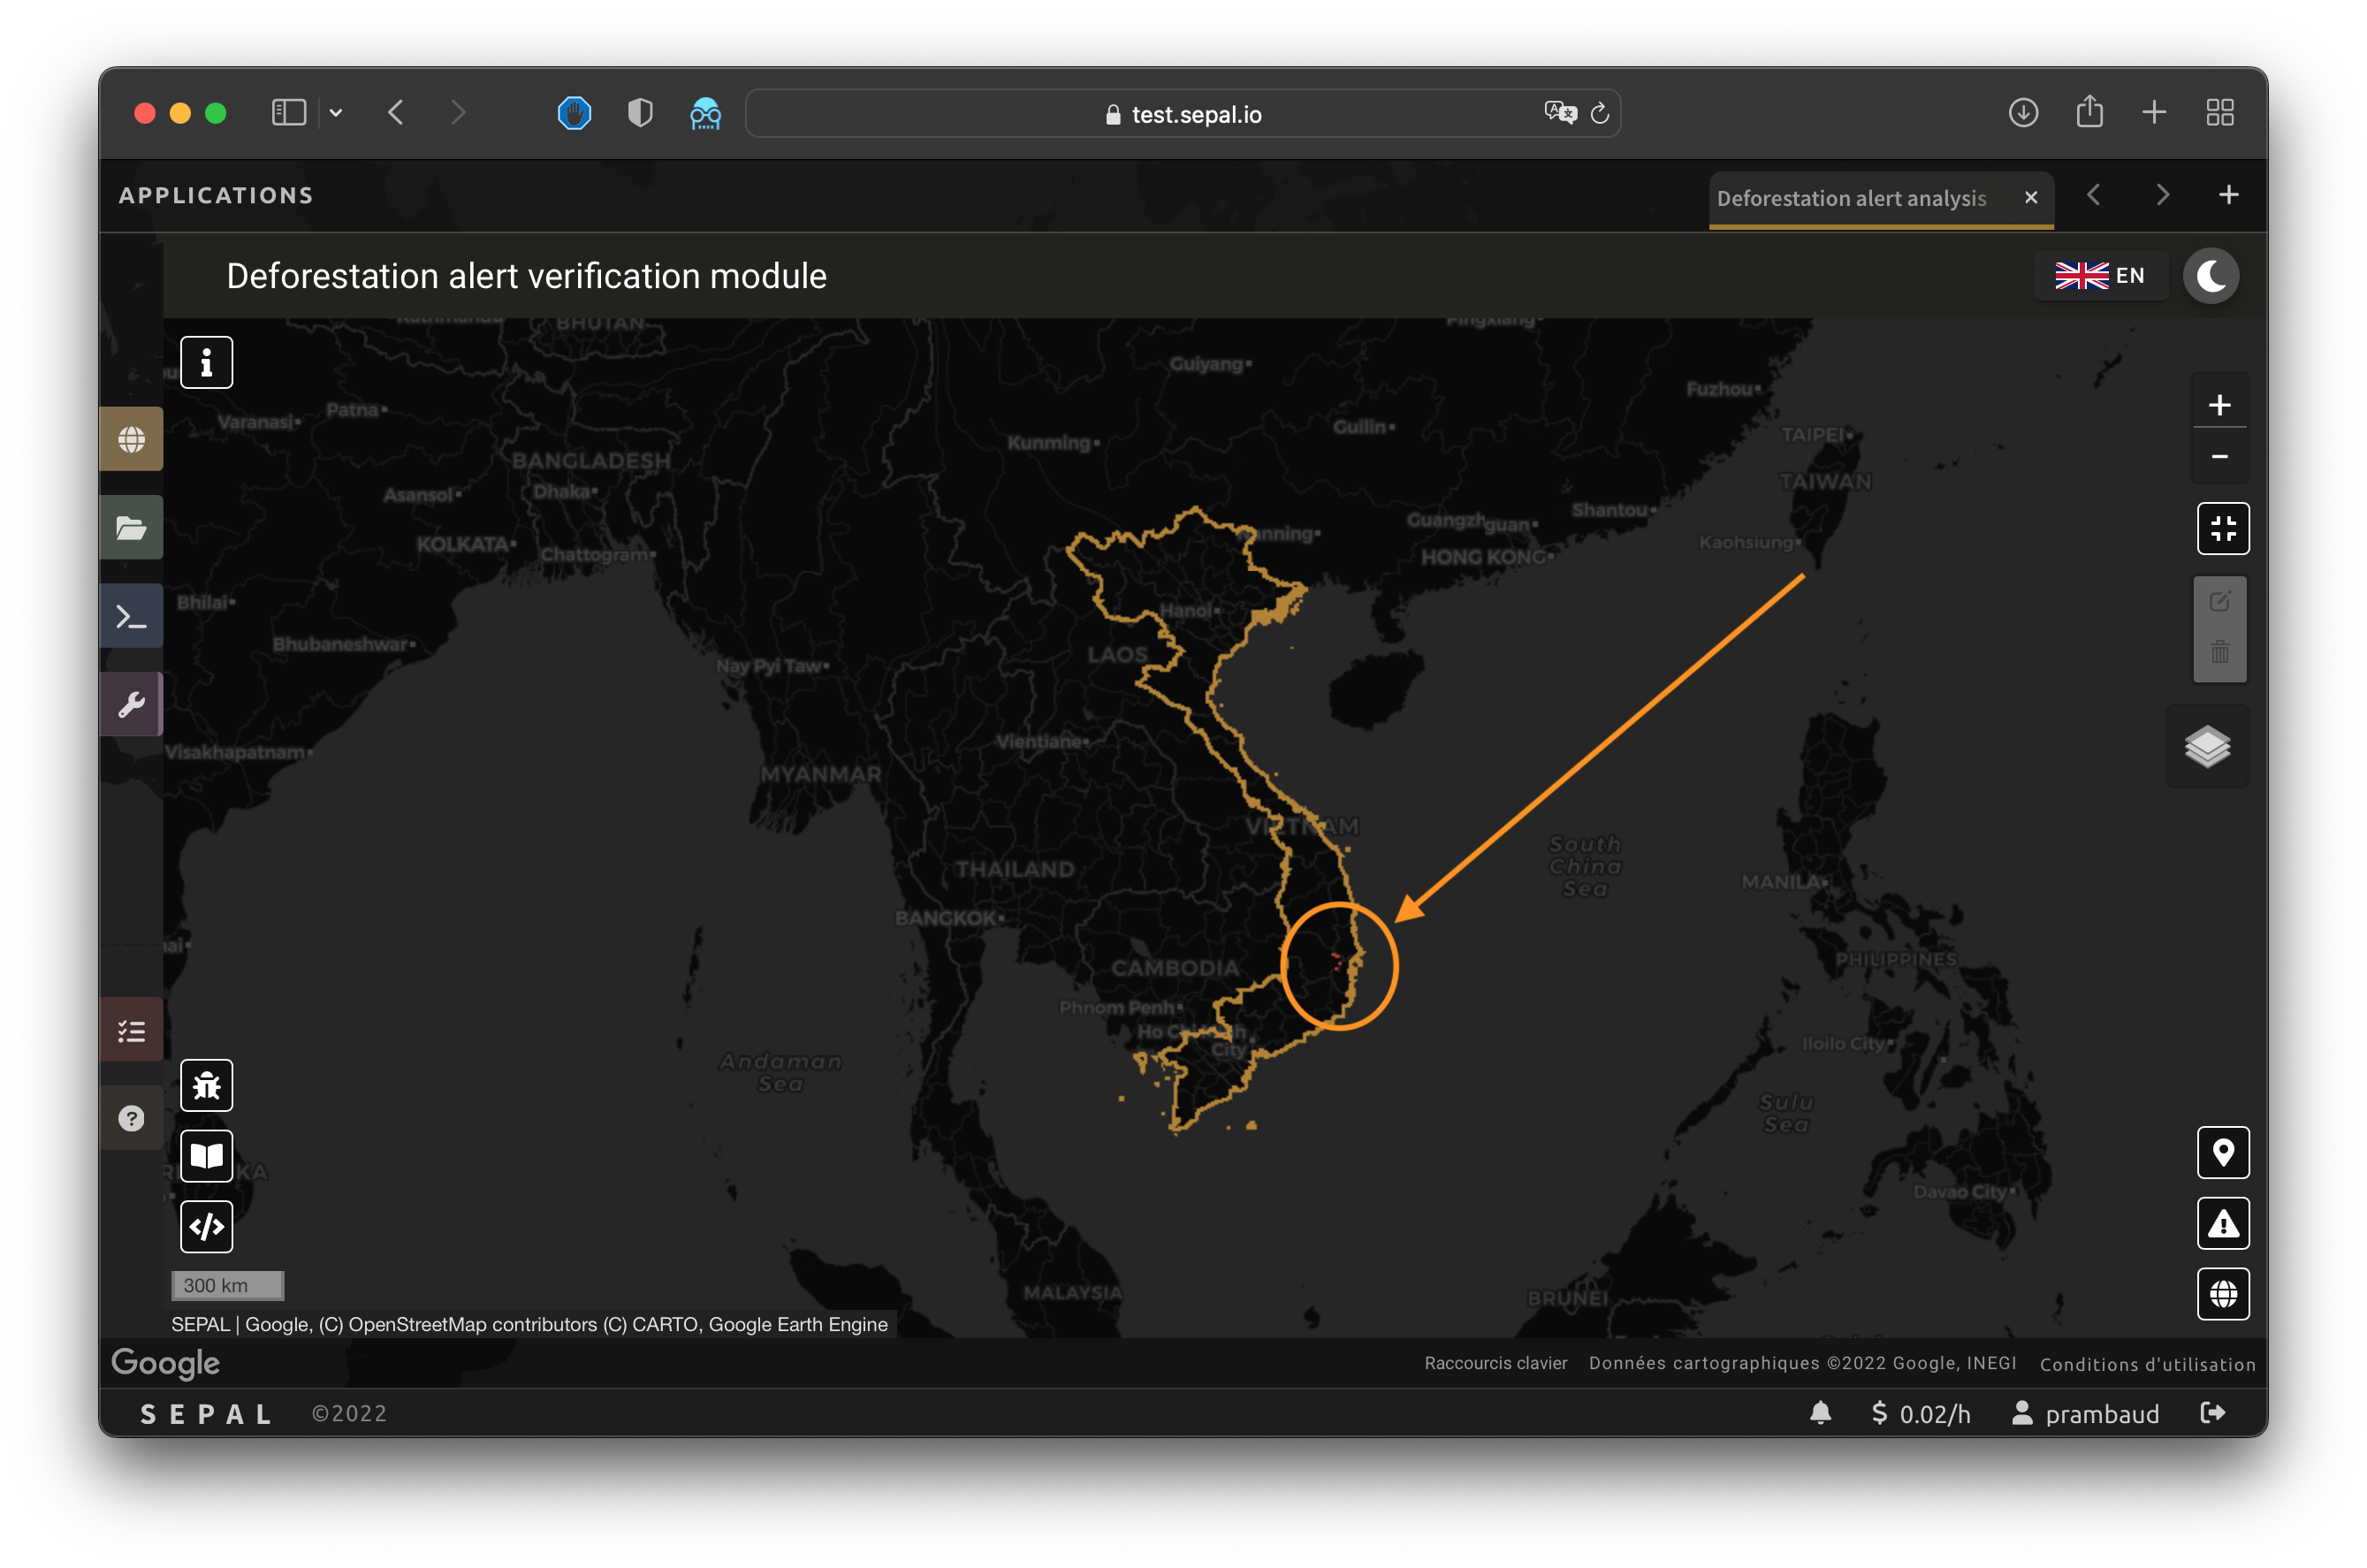
The AOI is set using the same interface as in other applications (see AOI selection).
In this step, select any type of AOI method. When validated, the AOI will be displayed in gold on the map.
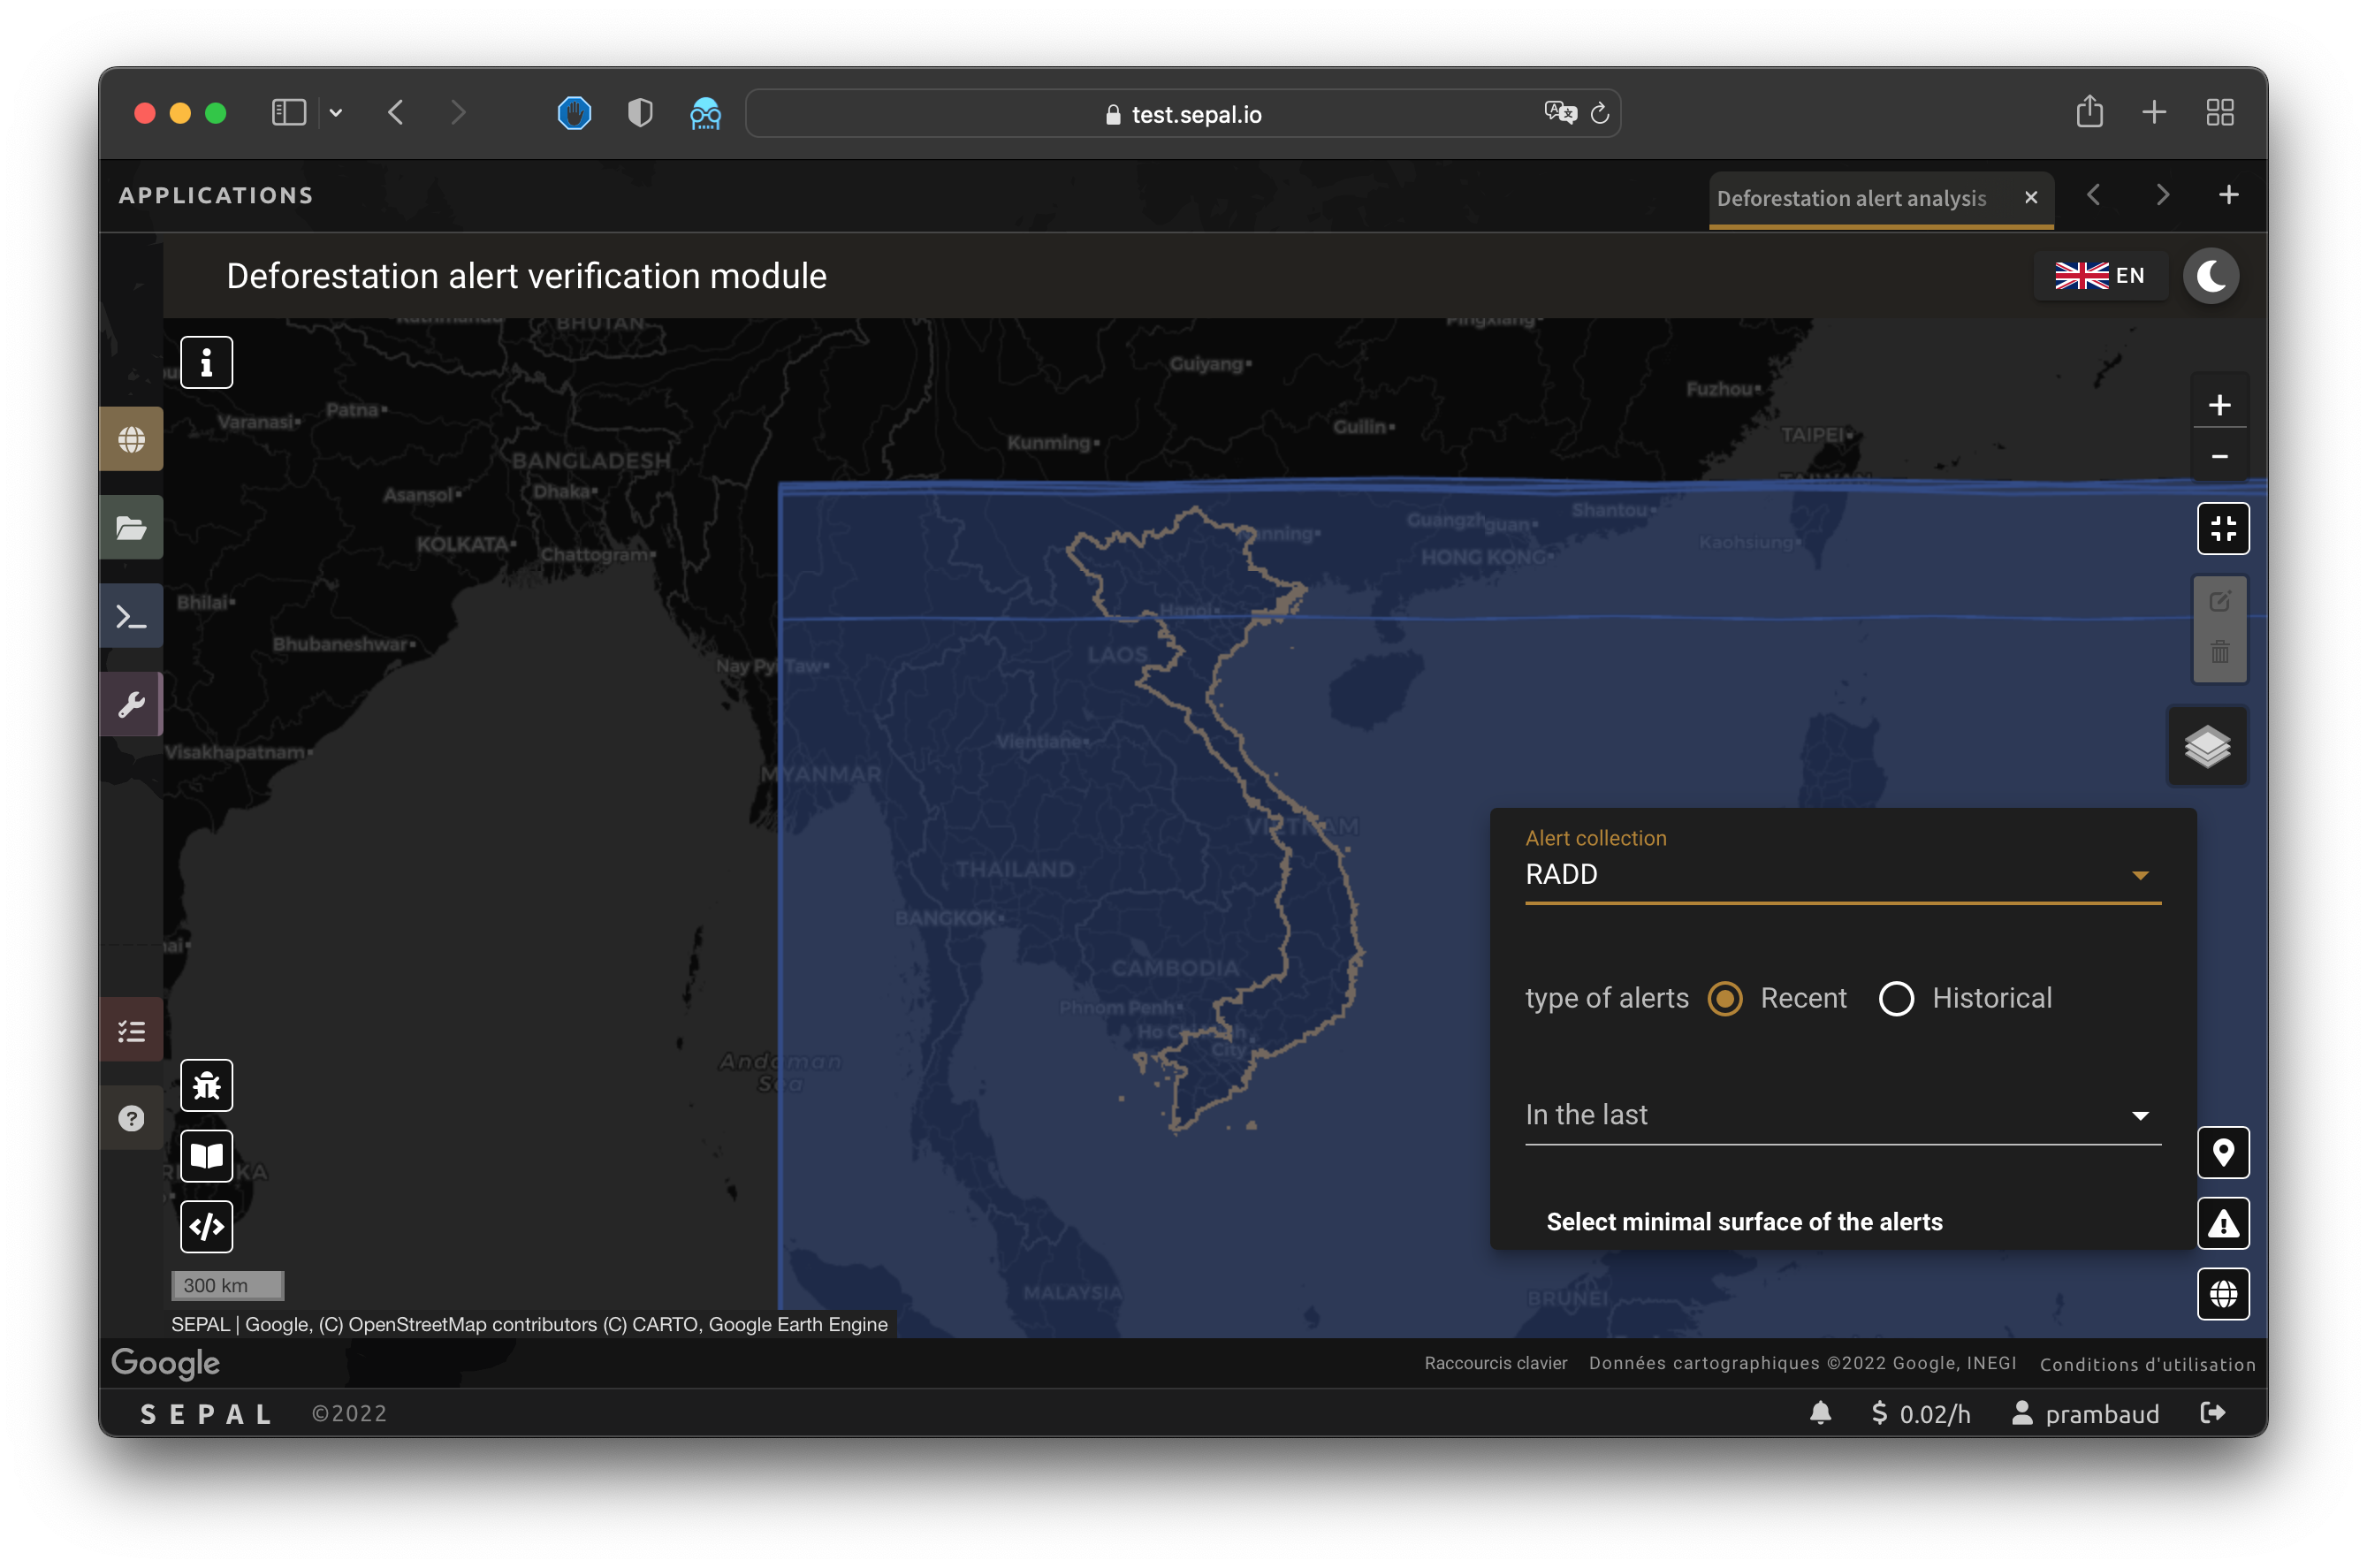
Alert#
The user then needs to select the alert system. Various drivers are available in the module and the documentation will reflect any changes or addition made by the SEPAL team.
Follow this process:
Select a driver in the dropdown list. The module will show the area covered by the driver in blue. If you don’t see a background color change, your AOI is not covered.
Select a date range. It can be XX days in the past using Recent mode or any time in the past using Historical mode.
Using the slider, filter the minimum size of the alerts from 0 to 100 ha (0 corresponds to no filter at all).
Note
Since some alert drivers are already filtered by dates, the Date selector is not always displayed.
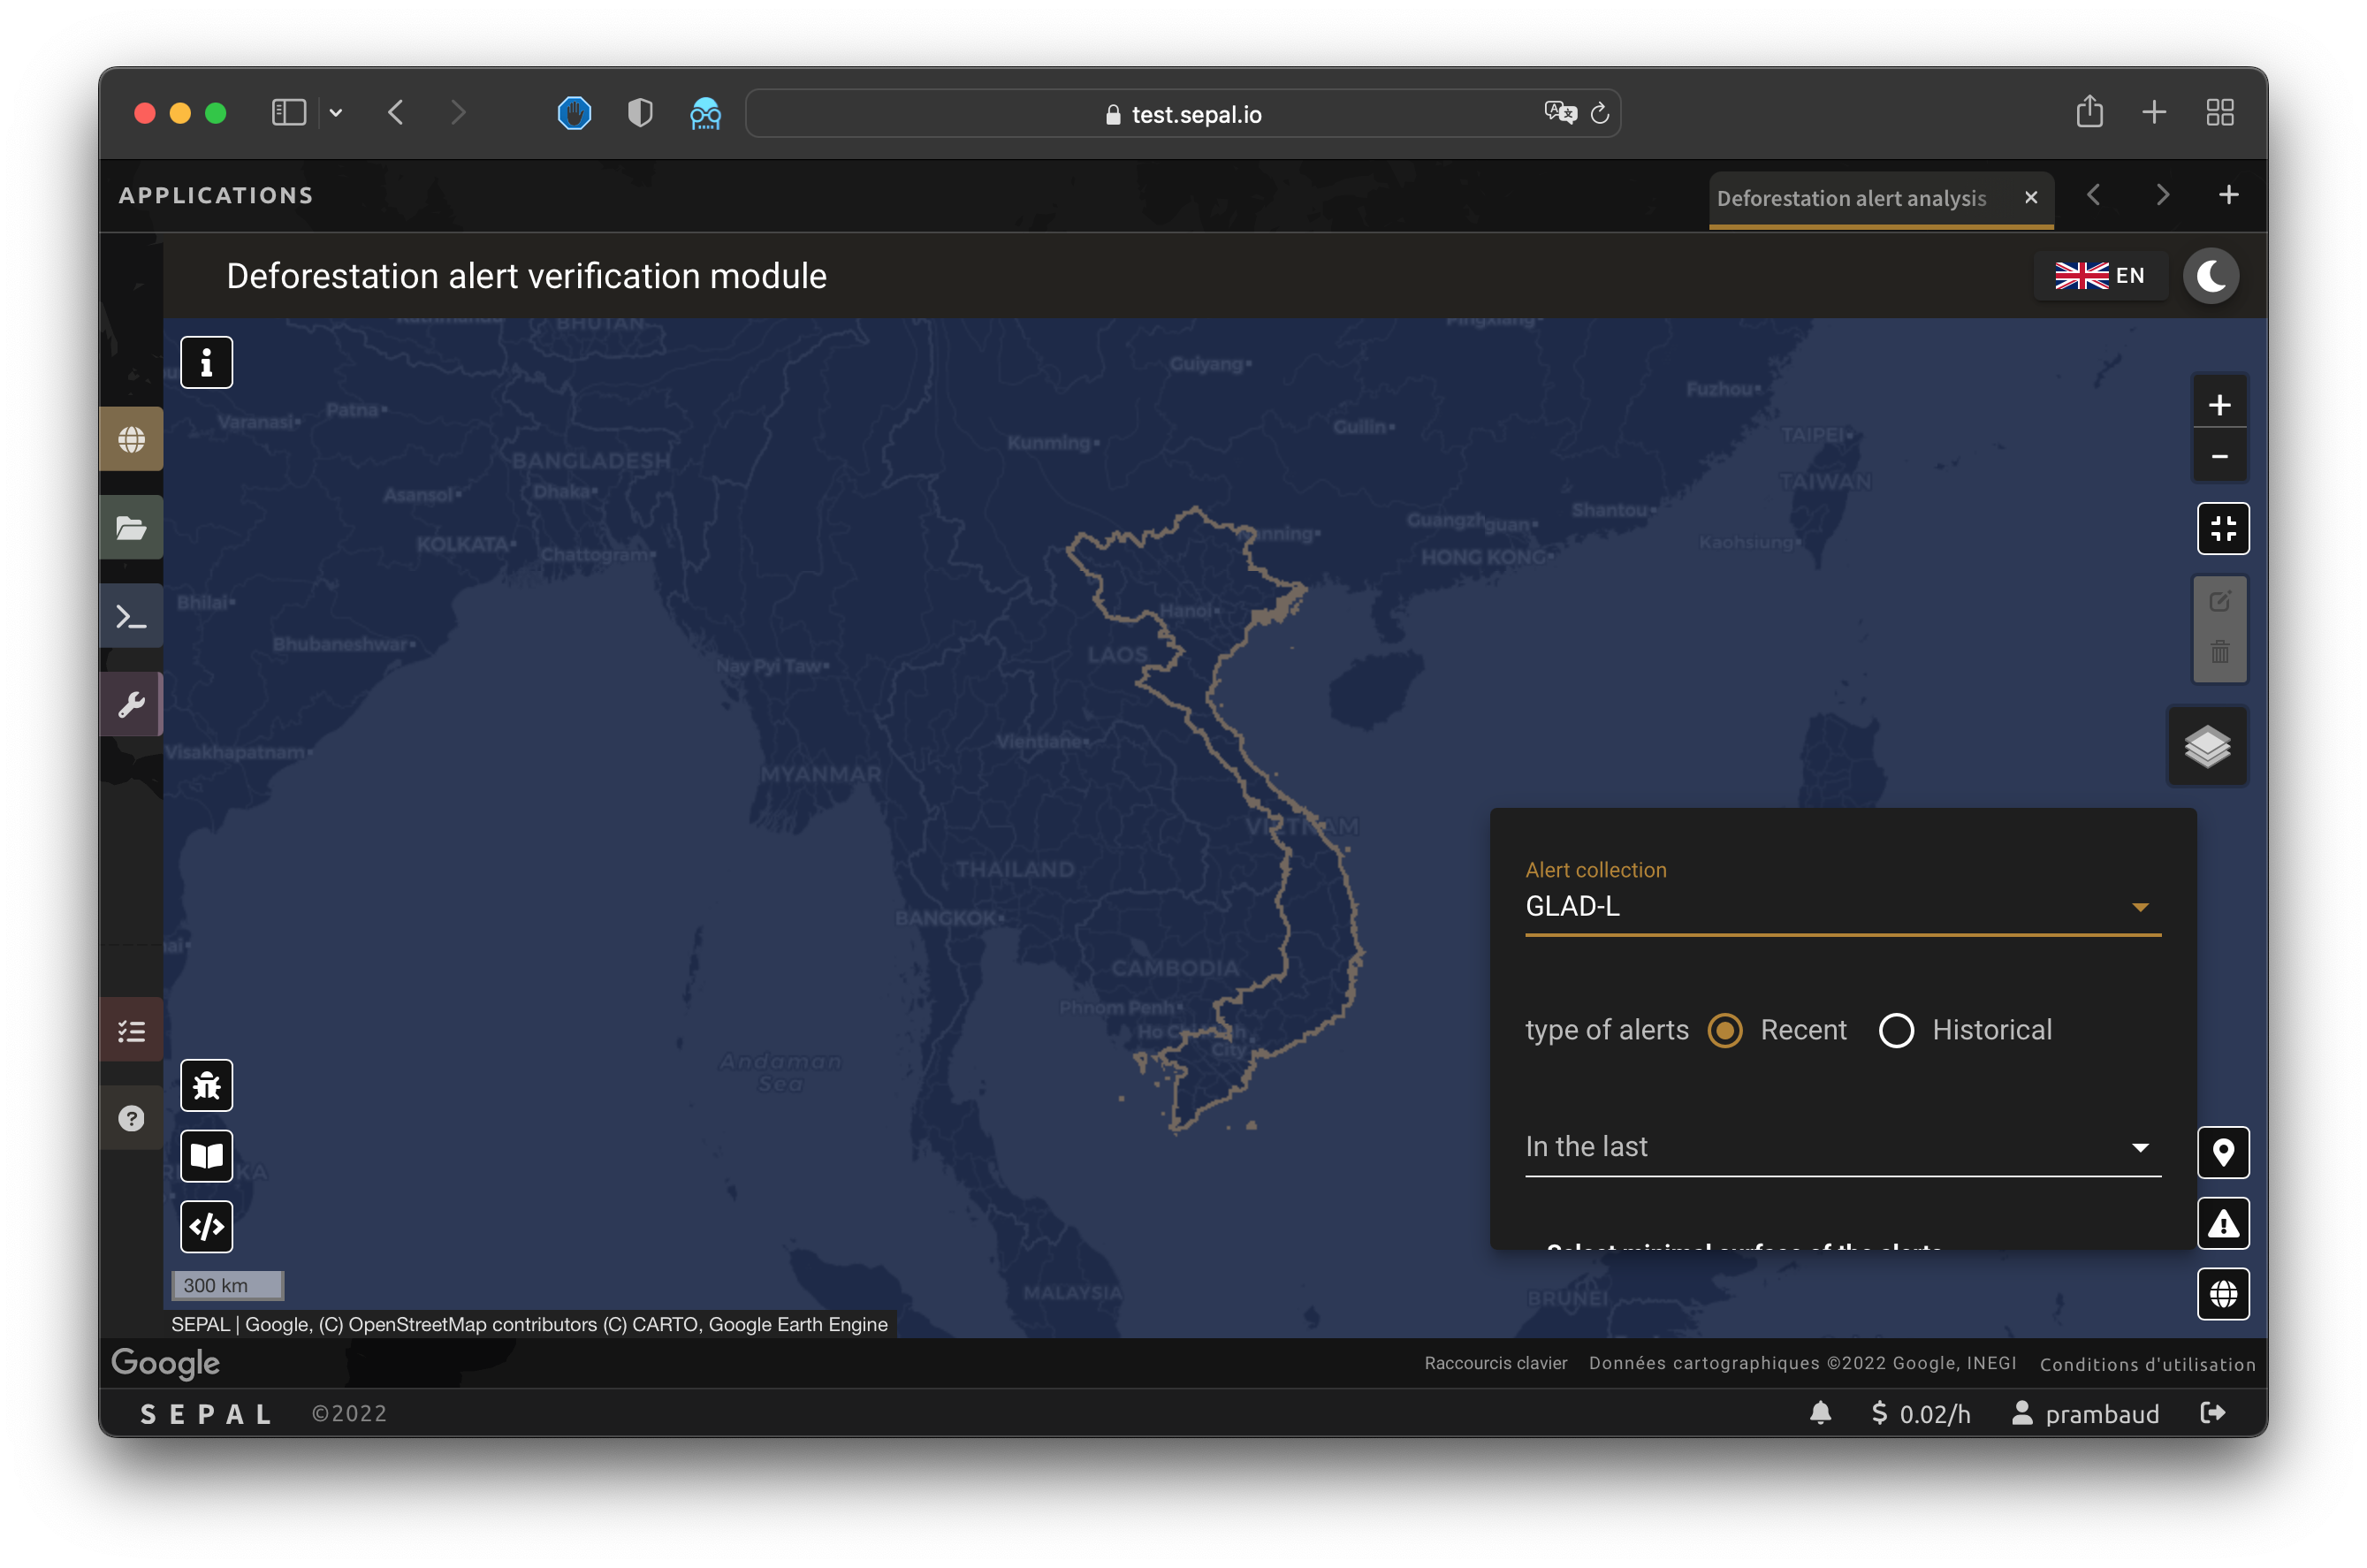


GLAD-L#
By selecting this alert system, you will use Global Land Analysis and Discovery alerts based on Landsat satellites (GLAD-L).
Since the opening of the Landsat archive in 2008, medium spatial resolution data have been available for use in alert-based applications. Since 2013, two Landsat sensors – the Enhanced Thematic Mapper Plus (ETM+) onboard Landsat 7, and the Operational Land Imager (OLI) onboard Landsat 8 – have been systematically acquiring global multispectral observations at a 30 m spatial resolution. The orbits of the two spacecraft are coordinated to enable potential eight-day repeat coverage globally. Given this cadence, the use of Landsat as a near real-time (NRT) source of land change information is possible. The data displayed and made available here quantify forest disturbance events for the tropics using ETM+ and OLI data as an input. Daily updates are made for areas where quality land observations are acquired. We define forest cover as 5 m-tall trees with a canopy closure exceeding 30 percent. An alert is defined as any Landsat pixel that experiences a canopy loss in excess of 50 percent cover.
For more information on these alerts, see the GLAD forest alert page.
RADD#
Note
Radar for Detecting Deforestation (RADD) alerts only cover the tropical part of Africa and the Americas (for more information, see their documenation).
By selecting this alert system, you will use RADD alerts.
Sentinel-1’s cloud-penetrating radar consistently provides gap-free observations for the tropics every 6 to 12 days. In the densely cloud-covered tropics, this represents a major advantage for the rapid detection of small-scale forest disturbances such as subsistence agriculture and selective logging. RADD alerts contribute to the World Resources Institute’s Global Forest Watch initiative in providing timely and accurate information to support a wide range of stakeholders in sustainable forest management and law enforcement activities against illegal deforestation. The alerts are implemented in and available via GEE, the Global Forest Watch platform, the SEPAL platform, and EarthMap.org.
More information on these alerts can be found on the Wageningen University portal.
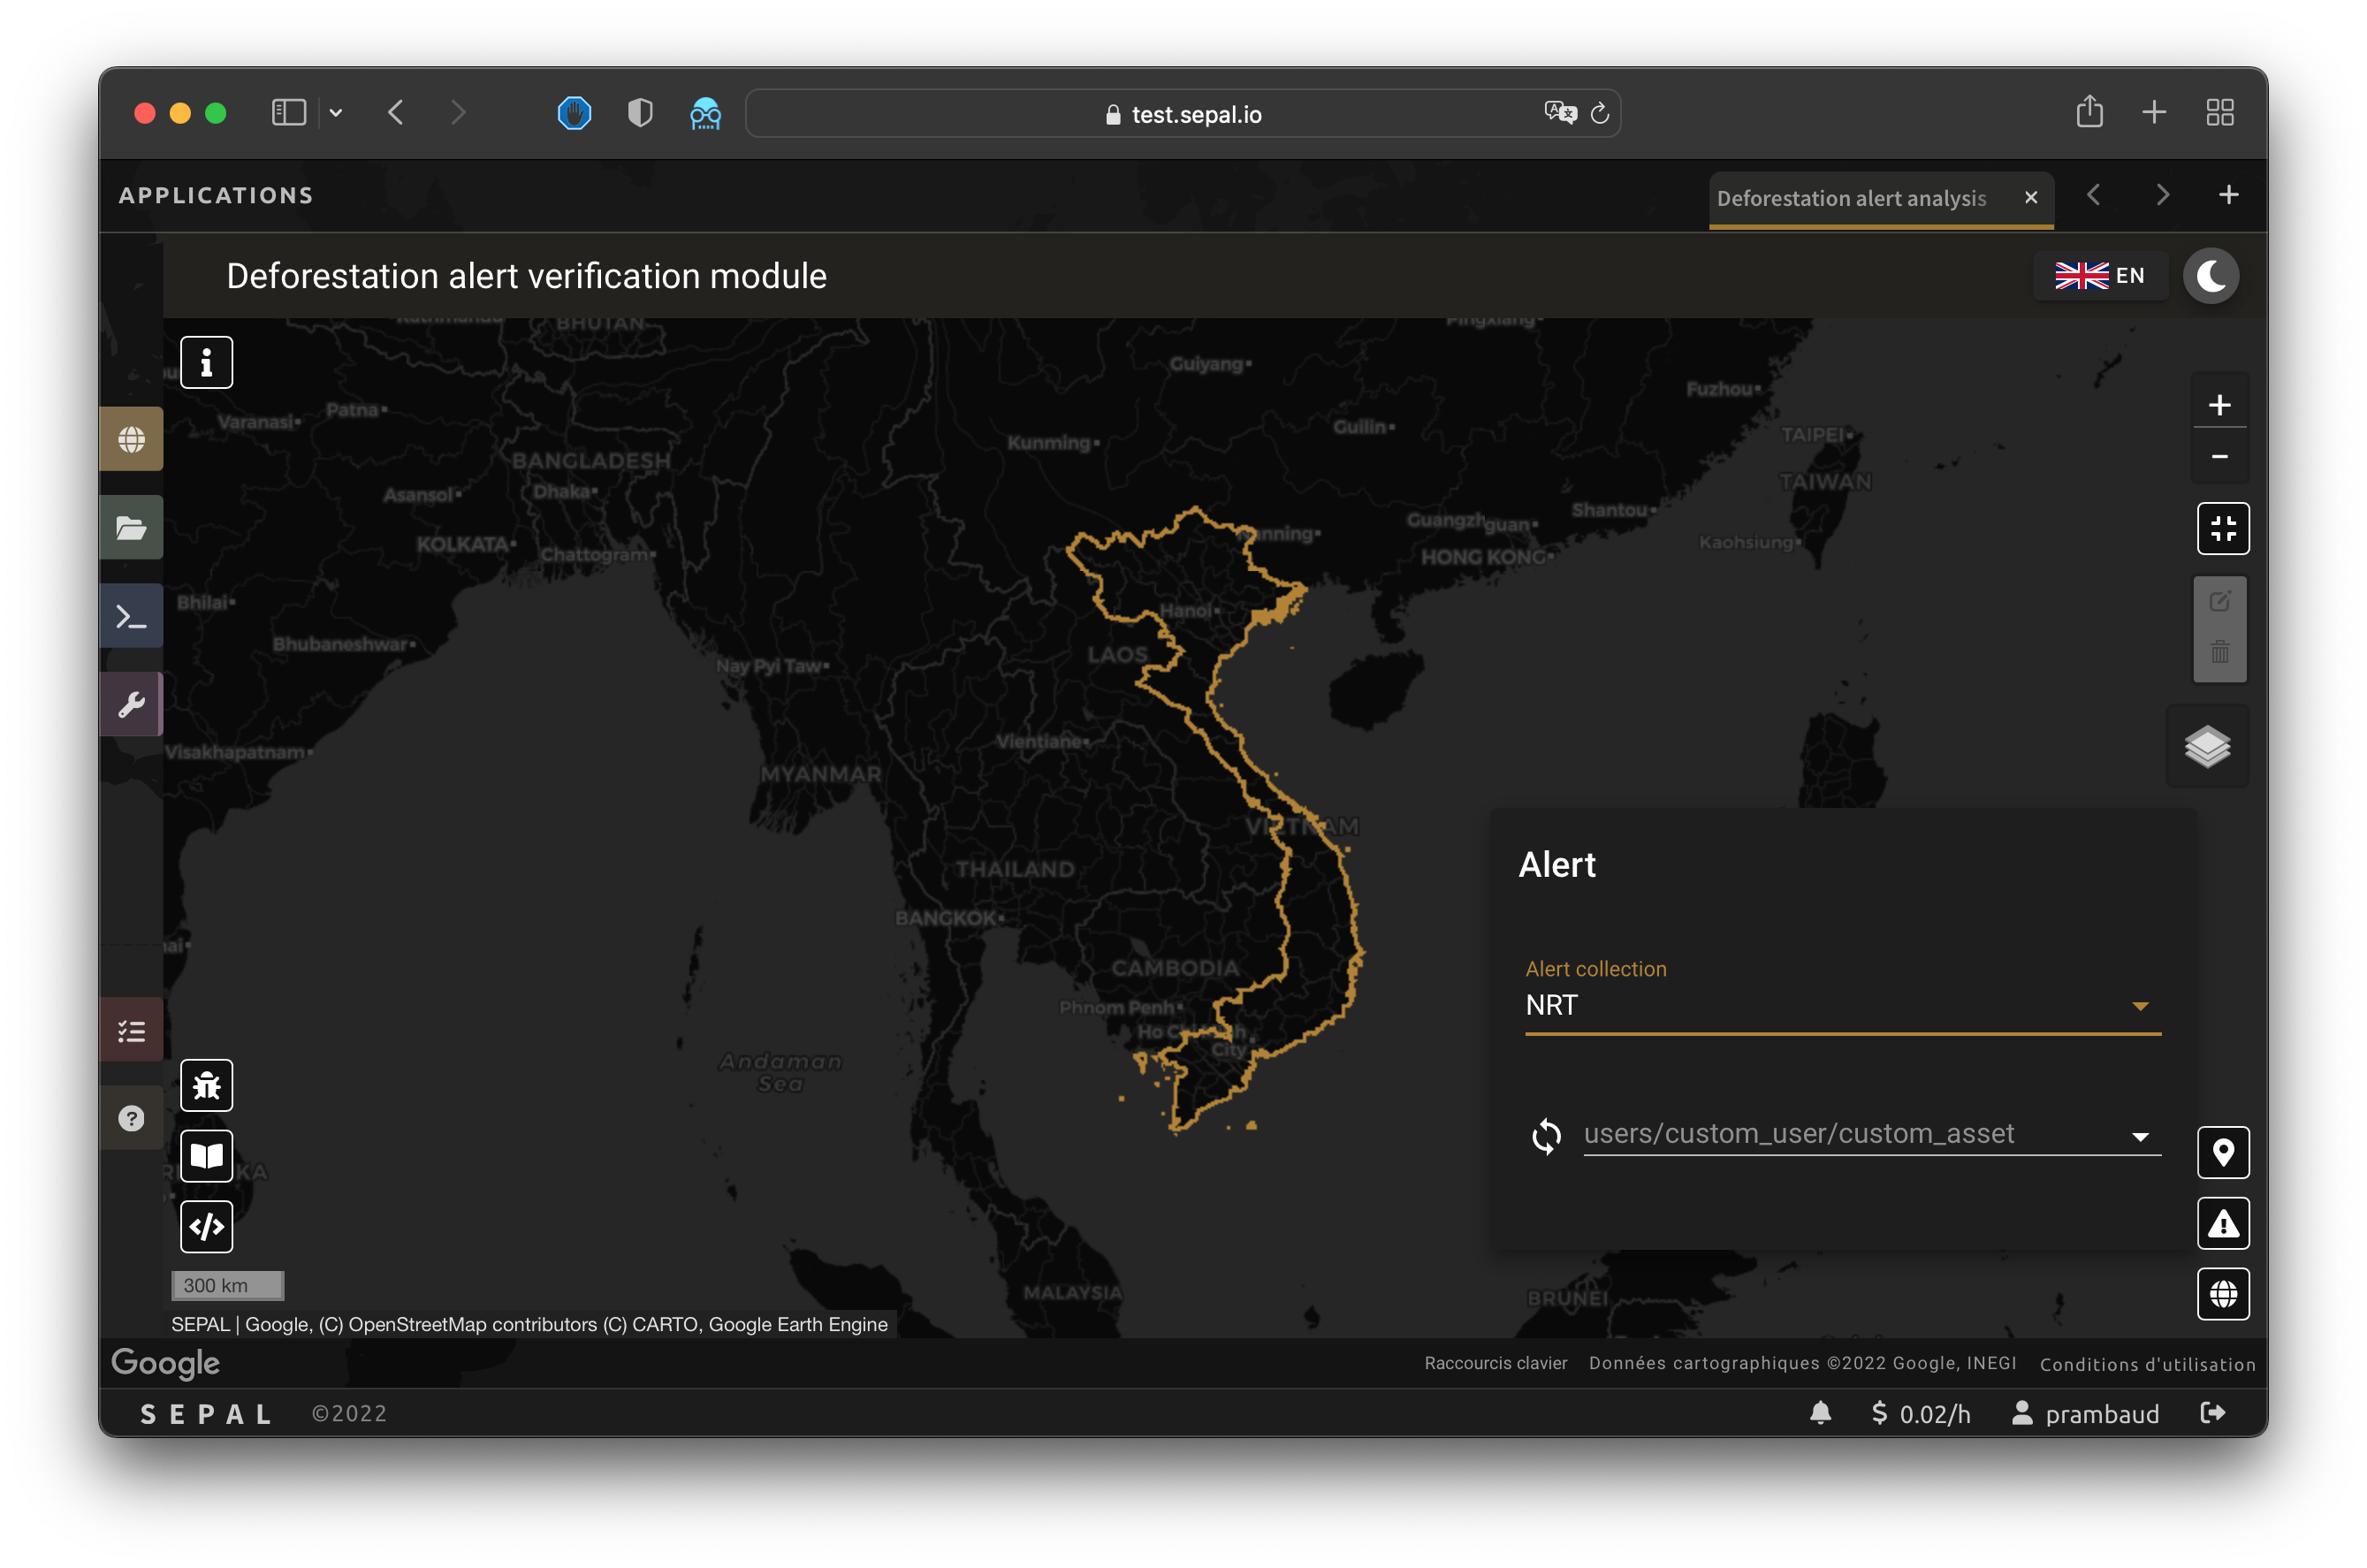
NRT#
Attention
This functionality will remain experimental until the SEPAL team removes the Beta status on the NRT alert creation recipe.
By selecting this alert system, users will use NRT alerts provided by the SEPAL recipe on a specific AOI for specific dates. You only need to provide access to the alert asset.
Note
The footprint of the alert is only displayed once the asset is selected.
GLAD-S#
Attention
At the time of writing this article (26 April 2022), only northern regions of South America were covered by the alert system. To see the area in the GEE code editor, see this page .
By selecting this alert system, you will use GLAD alerts based on Sentinel-2 satellites (GLAD-S).
Loss of primary forest is mapped in NRT at a 10 m resolution using Sentinel-2 multispectral data. Cloud, shadow and water are detected in each new Sentinel-2 image and a forest loss algorithm is applied to all remaining clear land observations. The algorithm relies on the spectral data in each new image, in combination with spectral metrics from a baseline period of the previous two years. Confidence is built through repeated loss observations in the consequent images.
CUSUM#
Note
This will use the .tif output of cusum.
Once you’ve run the CUSUM module, you’ll obtain a three-band .tif file (CUSUM refers to cumulative sum). Ingest this file in GEE using the code editor interface. Once the map is available in your assets, you can use it in the module. If you don’t find the asset in the list, select the icon to reload your asset list.
Note
The footprint of the alert is only displayed once the asset is selected.
SINGLE-DATE#
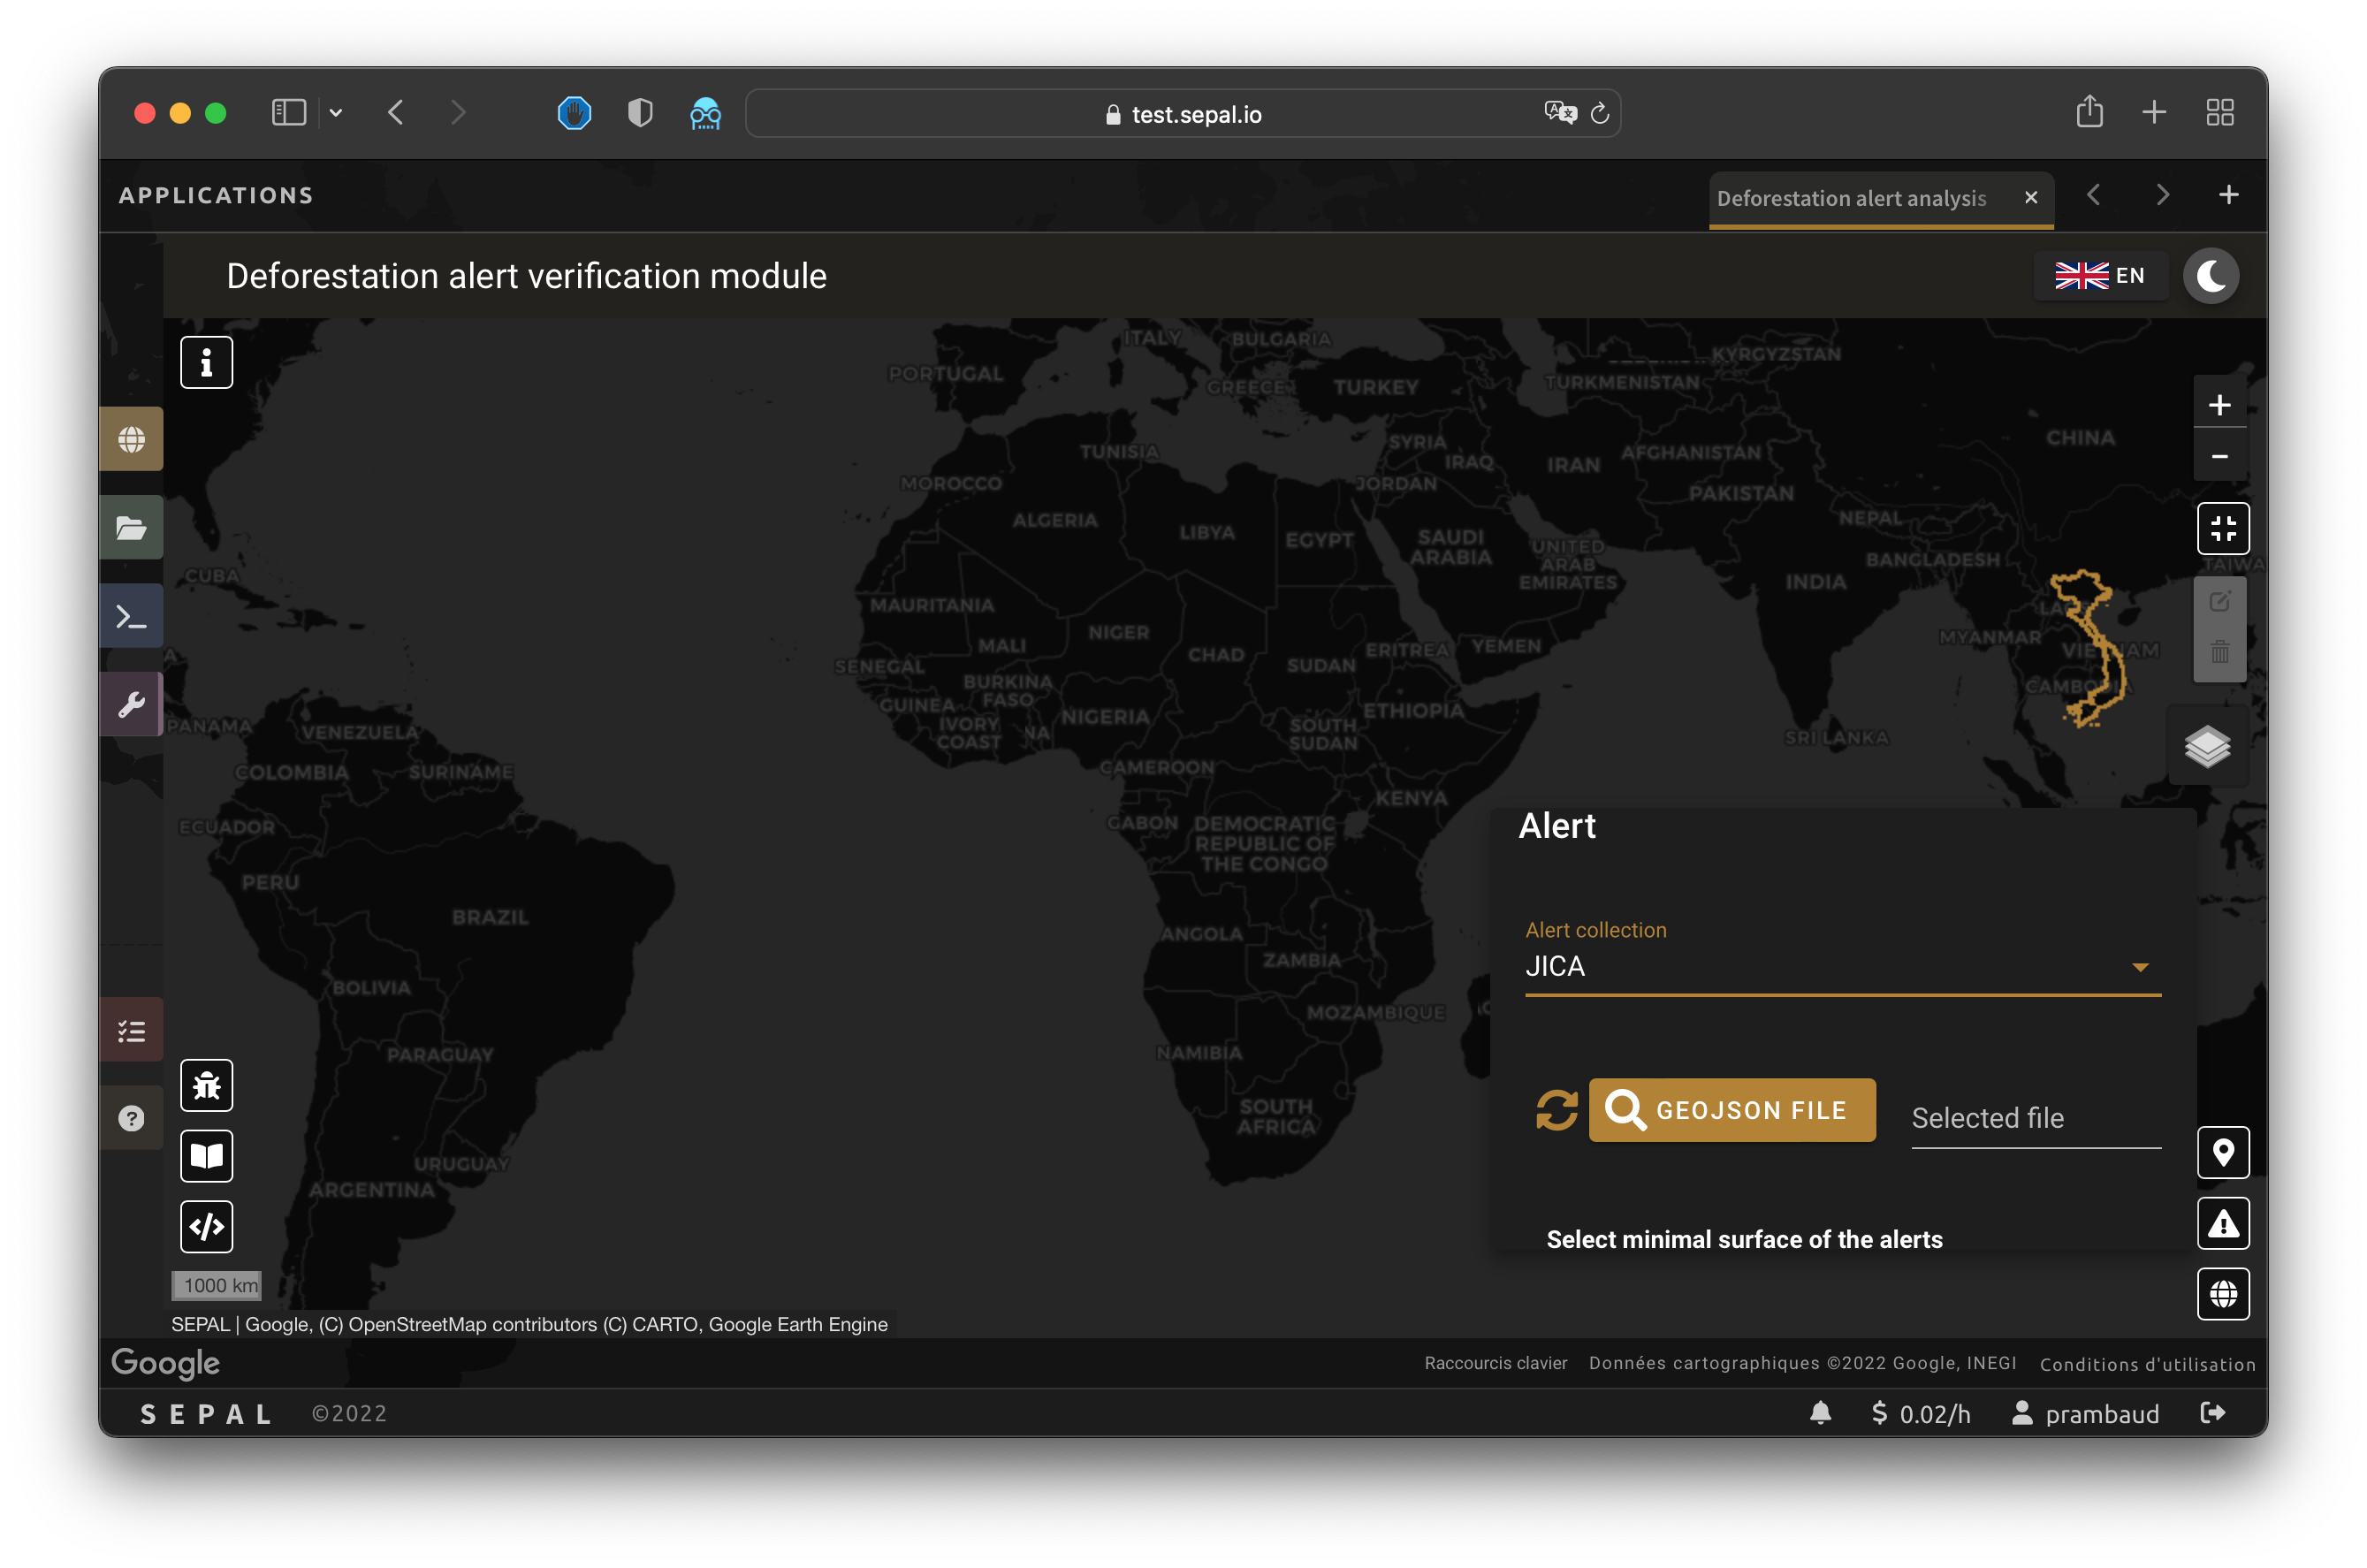
For this alert driver, the AOI parameter is ignored and all available alerts in the file will be loaded.
Any alert system including a vector file of geometries and metadata. If included, the label will be infered from the ID and the date of the alert (set by the user). By default, every alert will use this one, so Planet data will not directly point to the correct images.
The source needs to be a GeoJSON file using the following format:
{
        "type": "FeatureCollection",
        "features": [{
                "geometry": {
                        "coordinates": ["<feature_coordinates>"],
                        "geodesic": false,
                        "type": "Polygon"
                },
                "id": "+605258+71623",
                "properties": {
            "prop1": 0.0,
            "prop2": 0.0
                },
                "type": "Feature"
        },
    {"<other_feature_complete_description>"}
        ]
}
Note
The Vietnamese Forest Department is using a specific alert system that works well. Developed in partnership with Japan International Cooperation Agency (JICA), the system generates a GEOjson file every ten days. To see the GEE application, see this page (note: content is only available in Vietnamese).
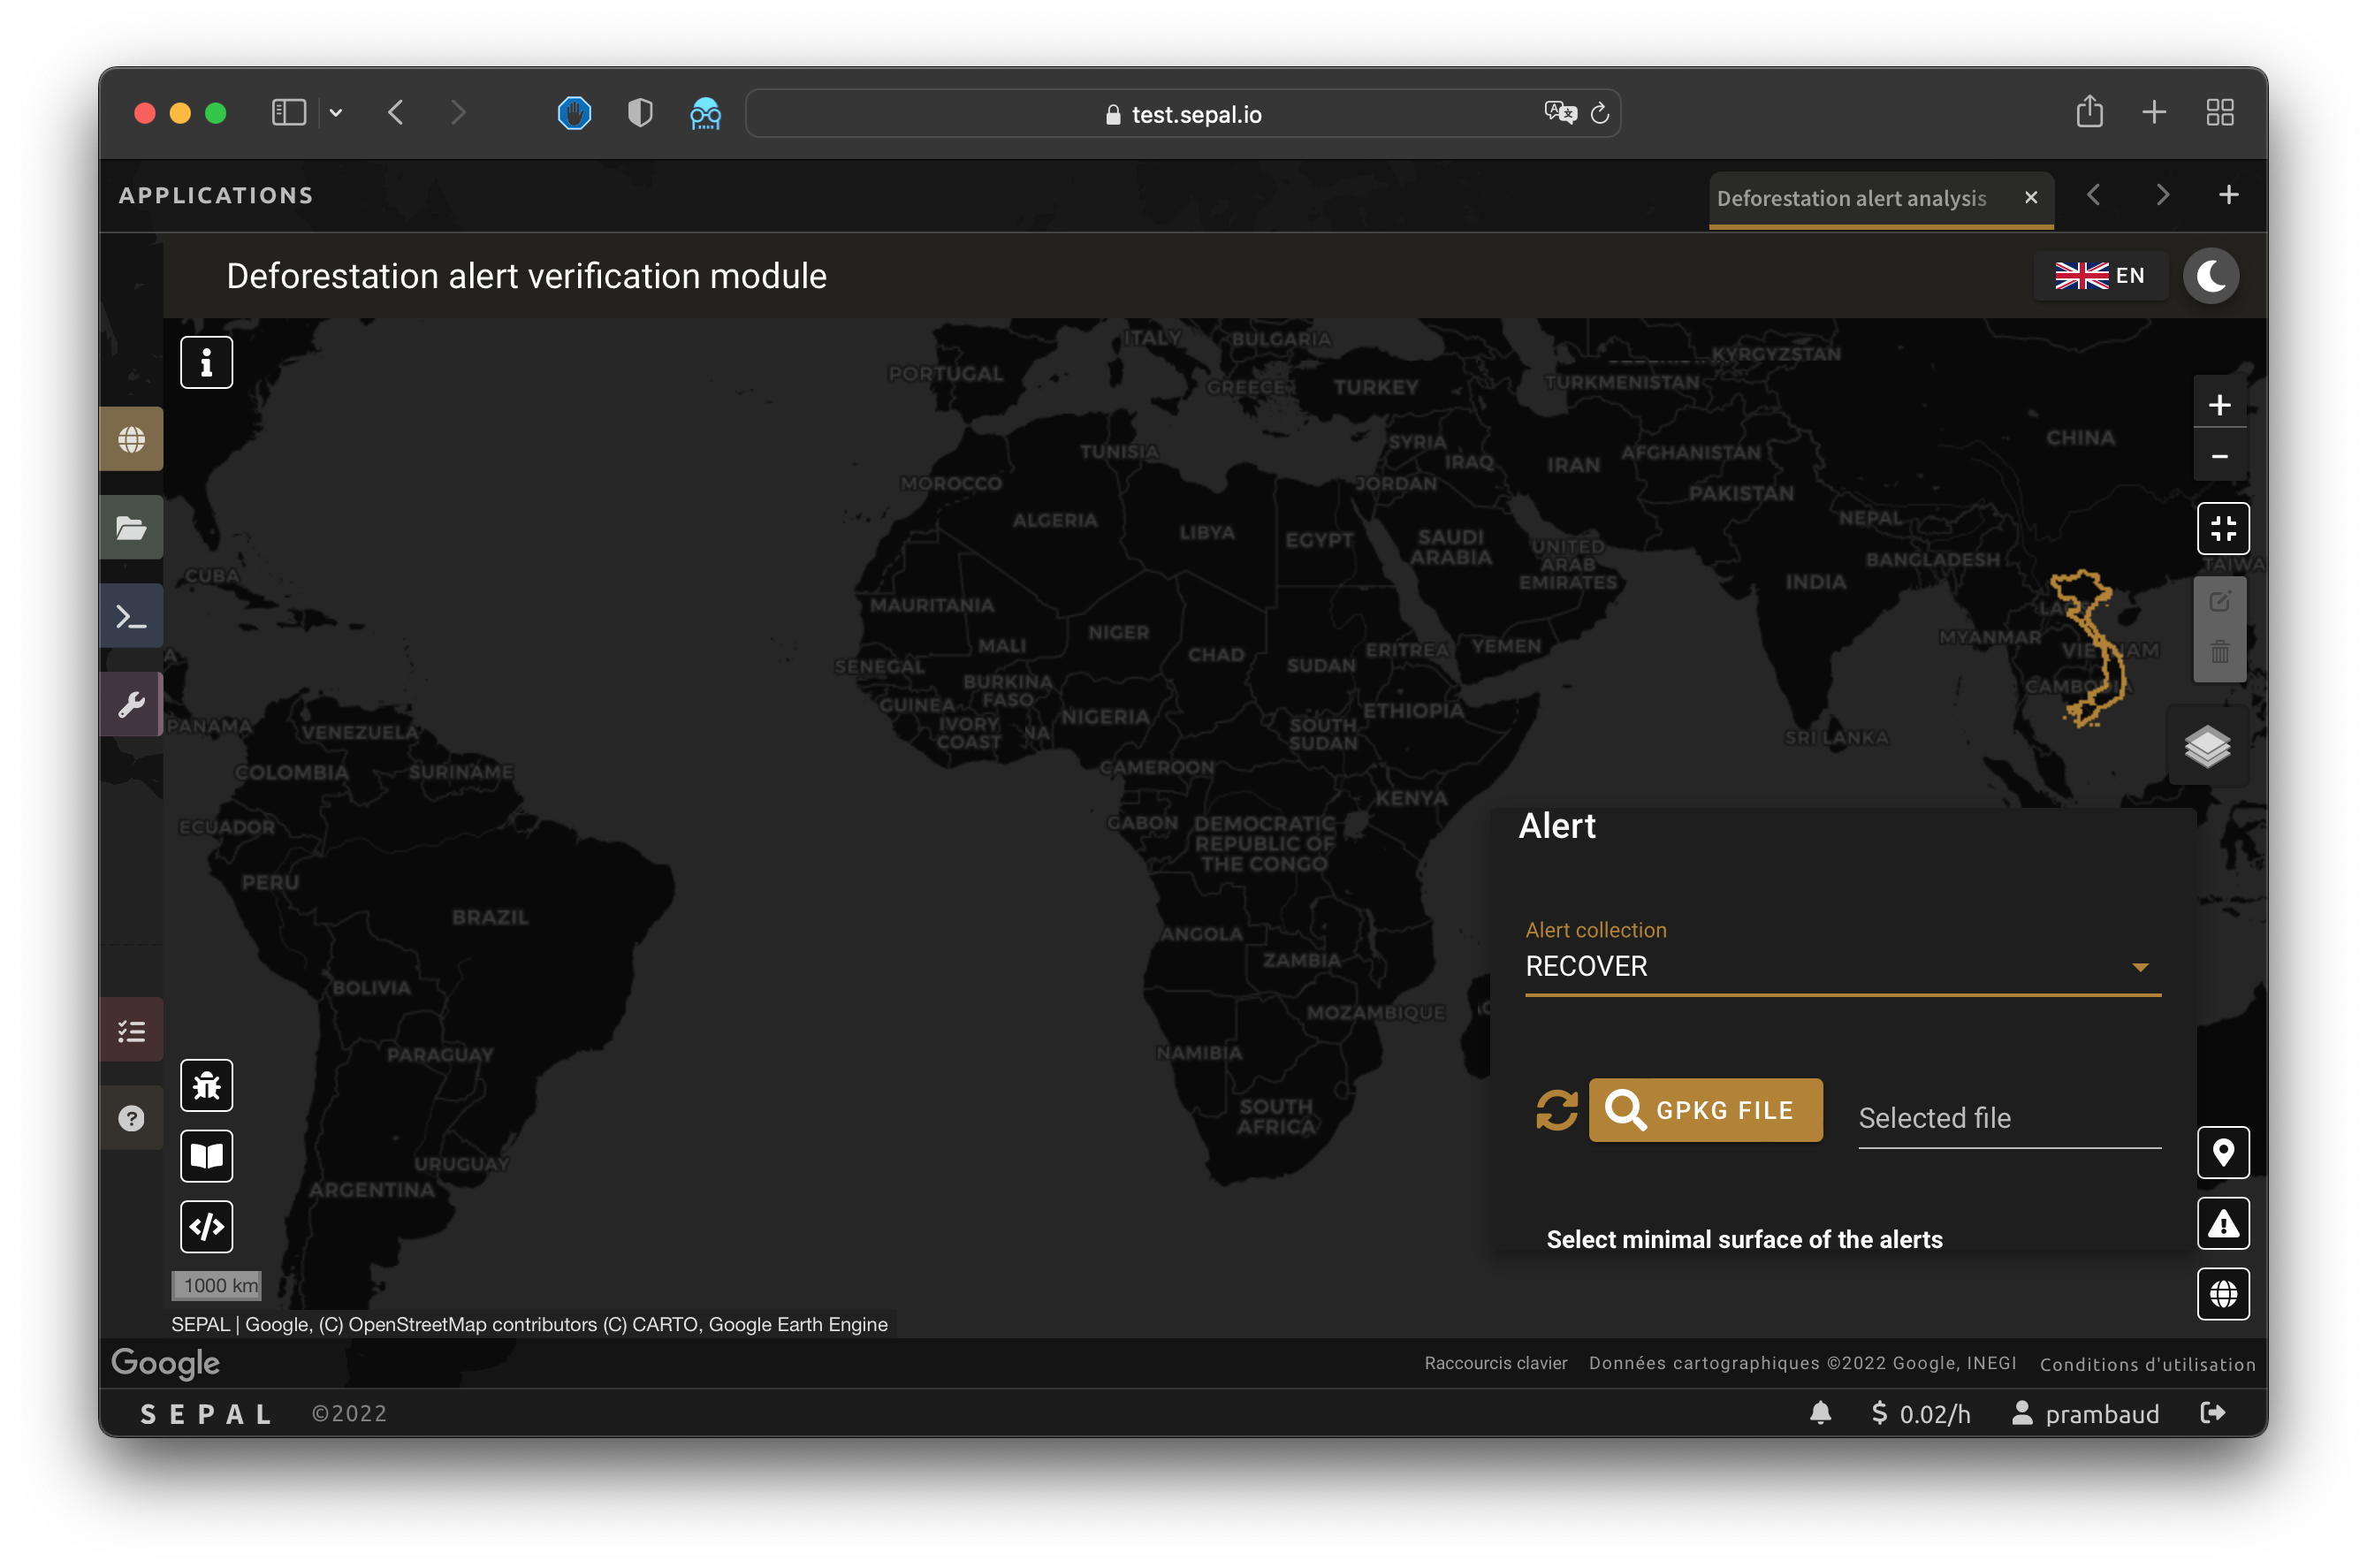
RECOVER#
For this alert driver, the AOI parameter is ignored and all available alerts in the file will be loaded.
Save your work by exporting the already interpreted alerts in .gpkg format. By selecting this format, you will be able to recover your previous analysis and continue the interpretation process.
JJ-FAST#
By selecting this alert system, you will use JJ-FAST alerts based on ALOS PALSAR data (JJ-FAST refers to the JICA-JAXA Forest Early Warning System in the Tropics; JAXA refers to Japan Aerospace Exploration Agency).
JJ-FAST can detect deforestation sites with sizes larger than 2 ha (Version 3.0, as of June 2020). Employing microwave remote sensing technology, detections can be made even under thick cloud cover, which is characteristic for tropical regions, especially during rainy seasons. The system detects deforestation by means of L-band (1.25 MHz) Synthetic Aperture Radar (SAR) data acquired by the PALSAR-2 sensor aboard JAXA’s Advanced Land Observing Satellite 2 (ALOS-2) and provides the positioning information of detected sites to users free of charge via its web service.
With frequent updates for the entire tropical forest belt – approximately every one and a half months – JJ-FAST aims to function as an effective deterrent against illegal deforestation activities when it is utilized for forest monitoring in target countries.
Government forest authorities of tropical countries with large forest inventories are expected to be the main users of JJ-FAST. Since polygons of detected deforestation cannot only be conveniently viewed online, but also downloaded for further geographic information system (GIS) analysis, local authorities are able to effectively identify illegal activities by comparing JJ-FAST detections with available national land use maps and/or concession maps.
Validation#
Once everything is set, select select alerts and the module will start downloading the information from GEE. The module will tile the AOI in smaller chunks to avoid GEE limitation; if you use a large area, downloading can take up to 15 minutes. The alerts are displayed as red shapes on the map. If alerts are found in your AOI, the settings panel will close automatically.
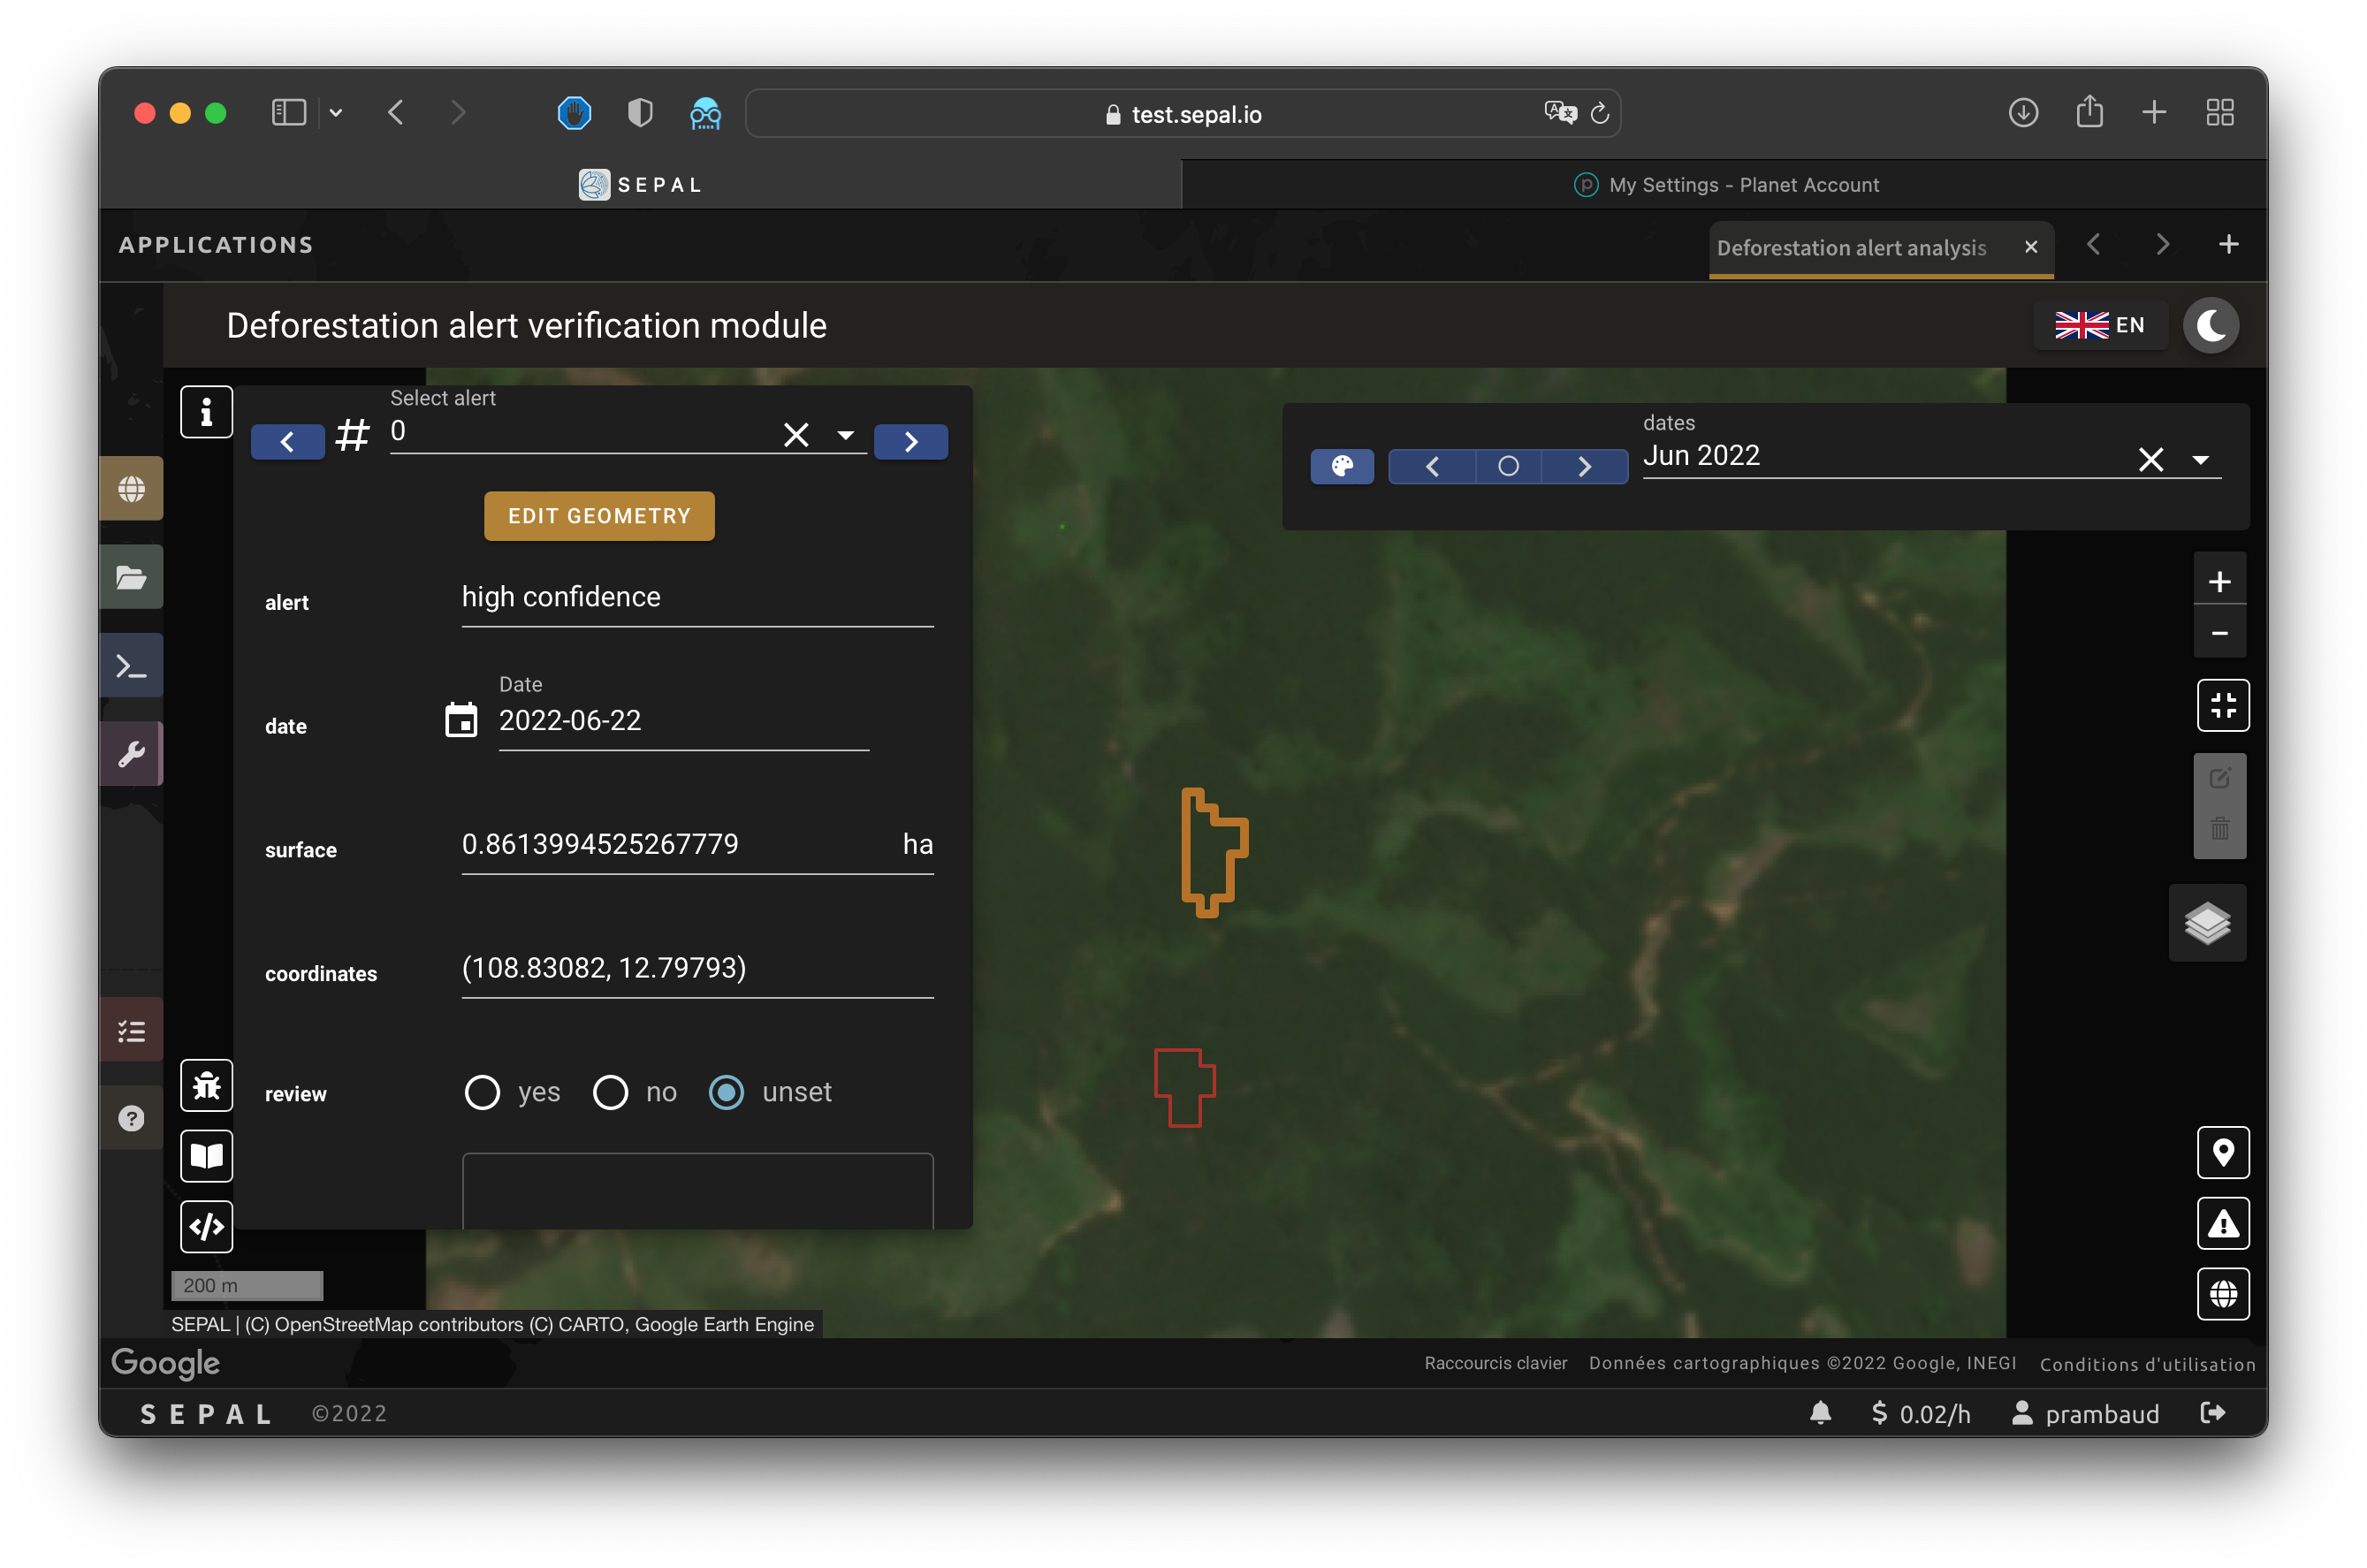
Metadata#
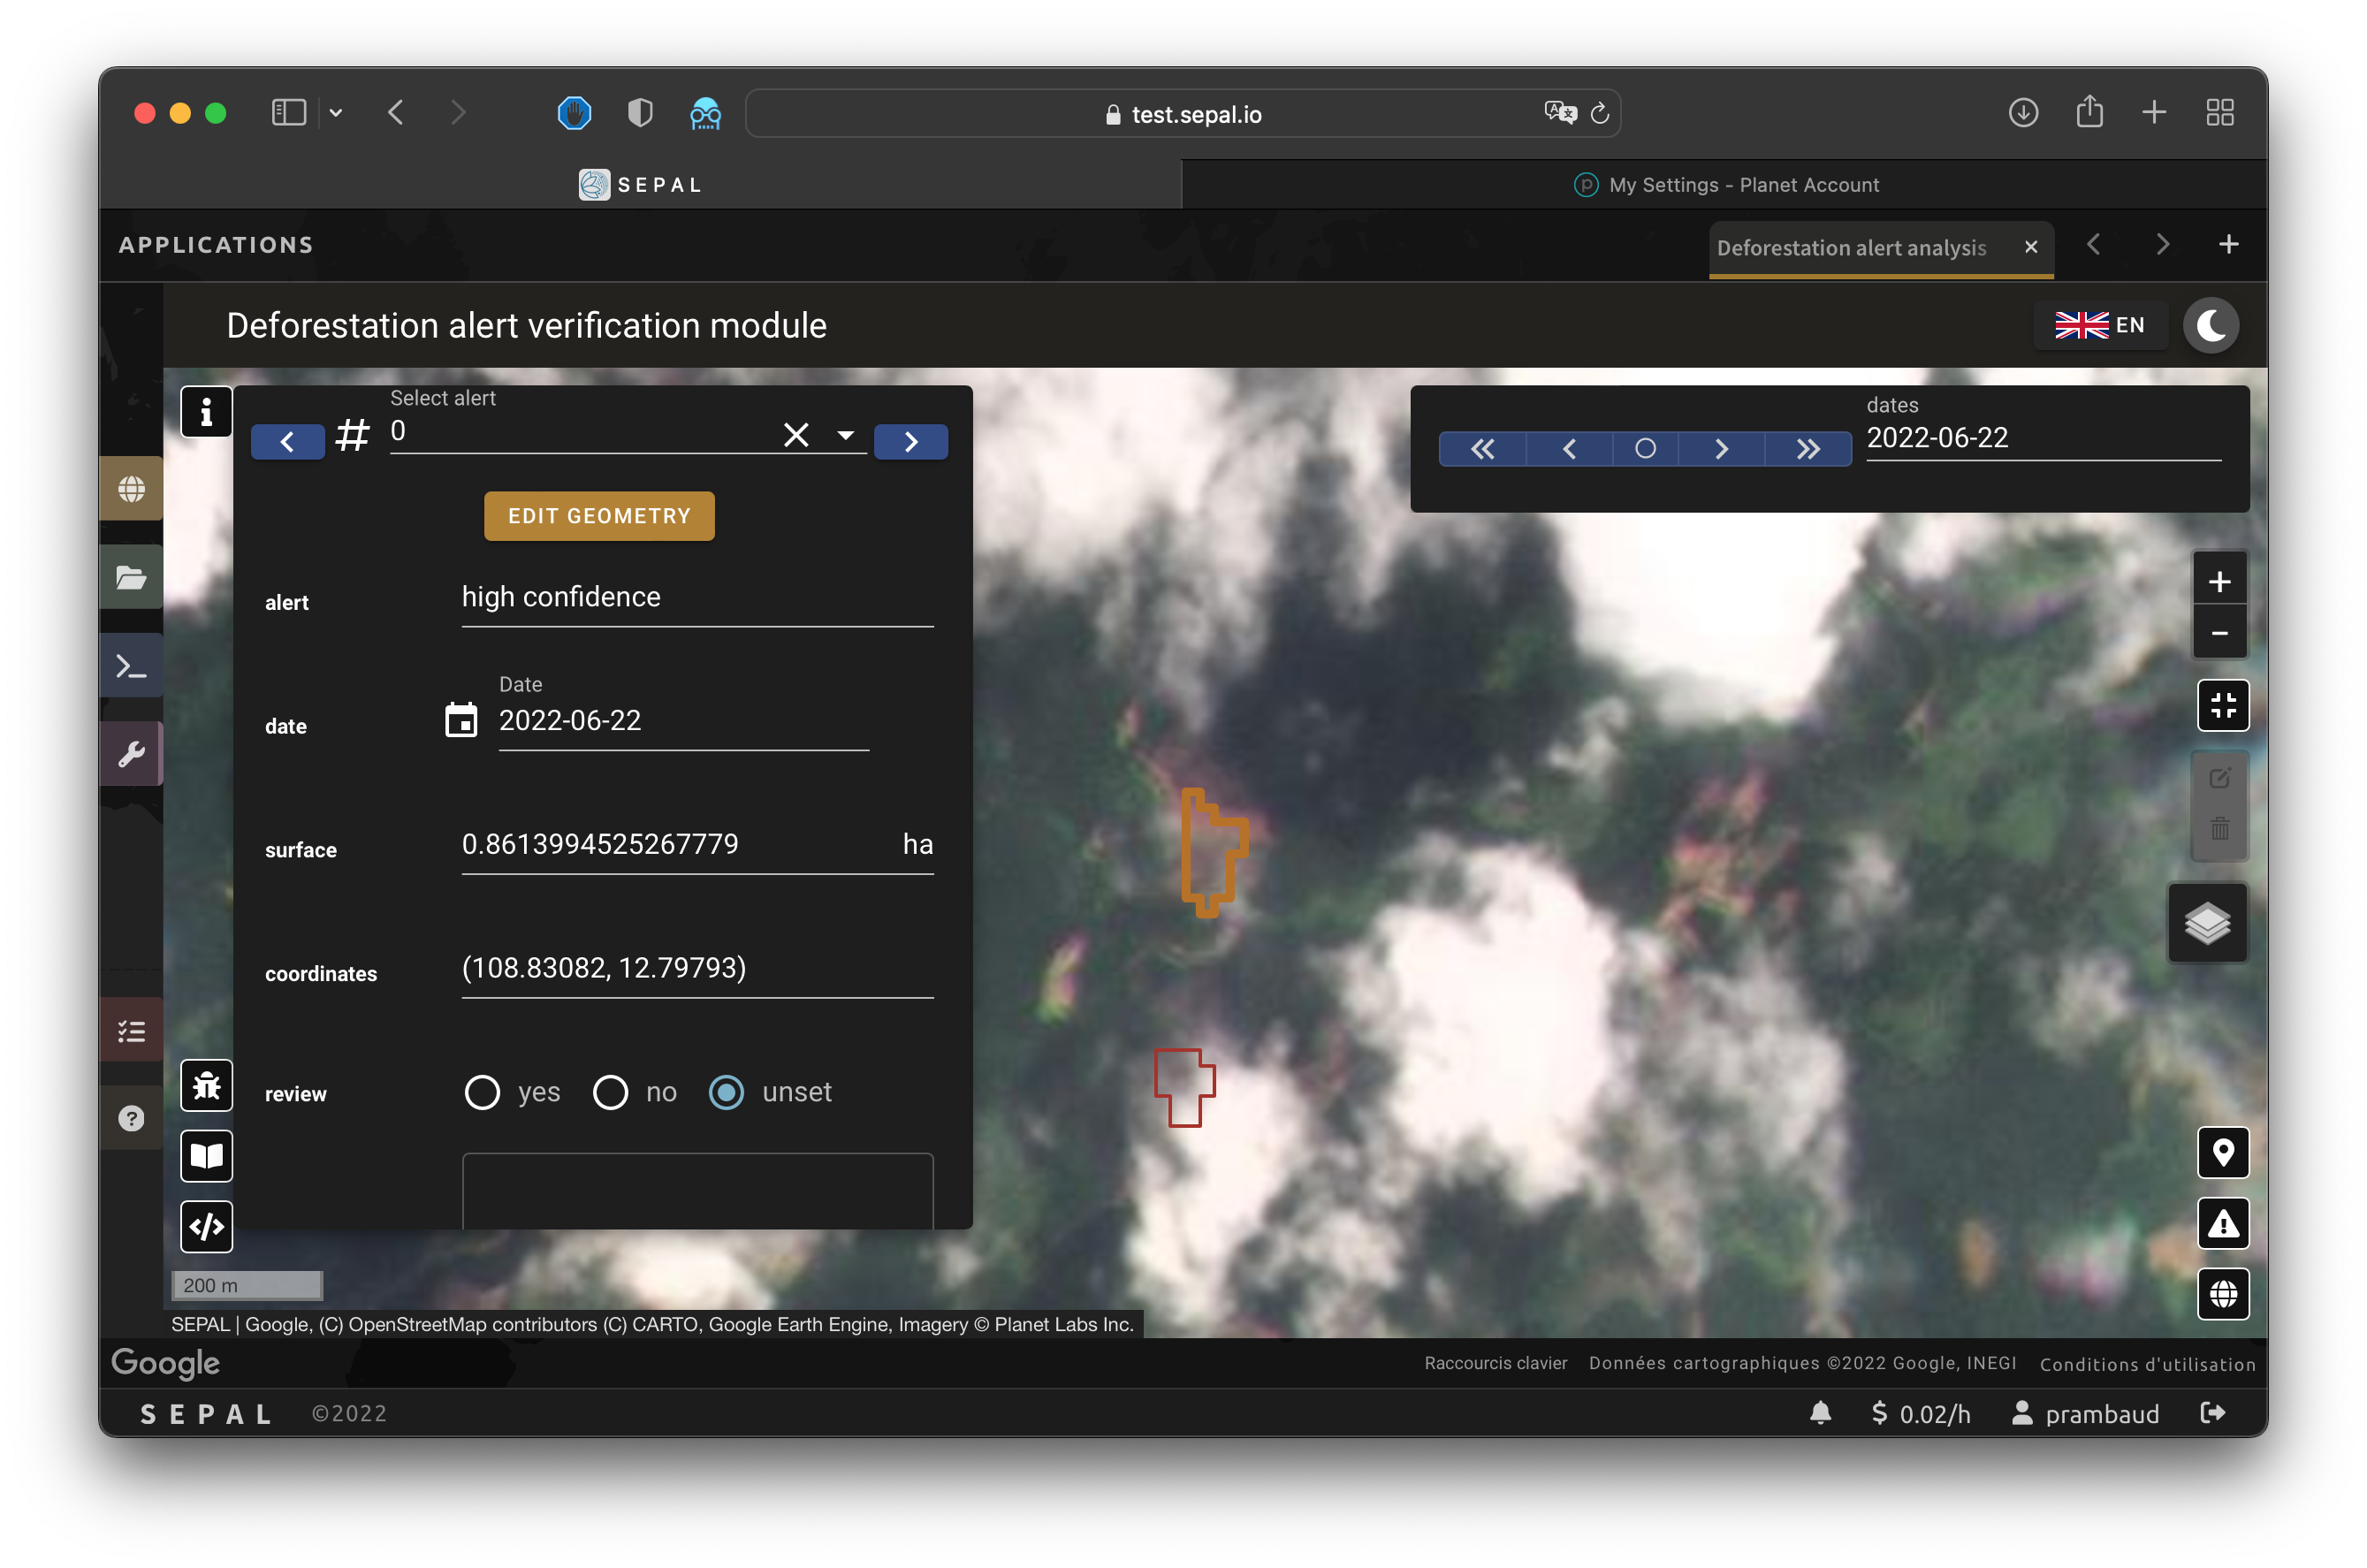
Select to show the Metadata pane, which allows you to validate alerts identified by the driver using Planet VHR (very high-resolution) imagery. The following information about the current alert will be displayed:
Alert ID: the ID of the alert
Geometry edition: a button to trigger geometry edition for one single alert
Date: the identified date of the deforestation event
Surface: the deforested surface in hectares
Coordinates: the coordinates of the centre of the alert
Review: the visual evaluation performed by the user
Comments: additional comments on the alert
The following subsections of this article will cover the editable fields in the Metadata pane.
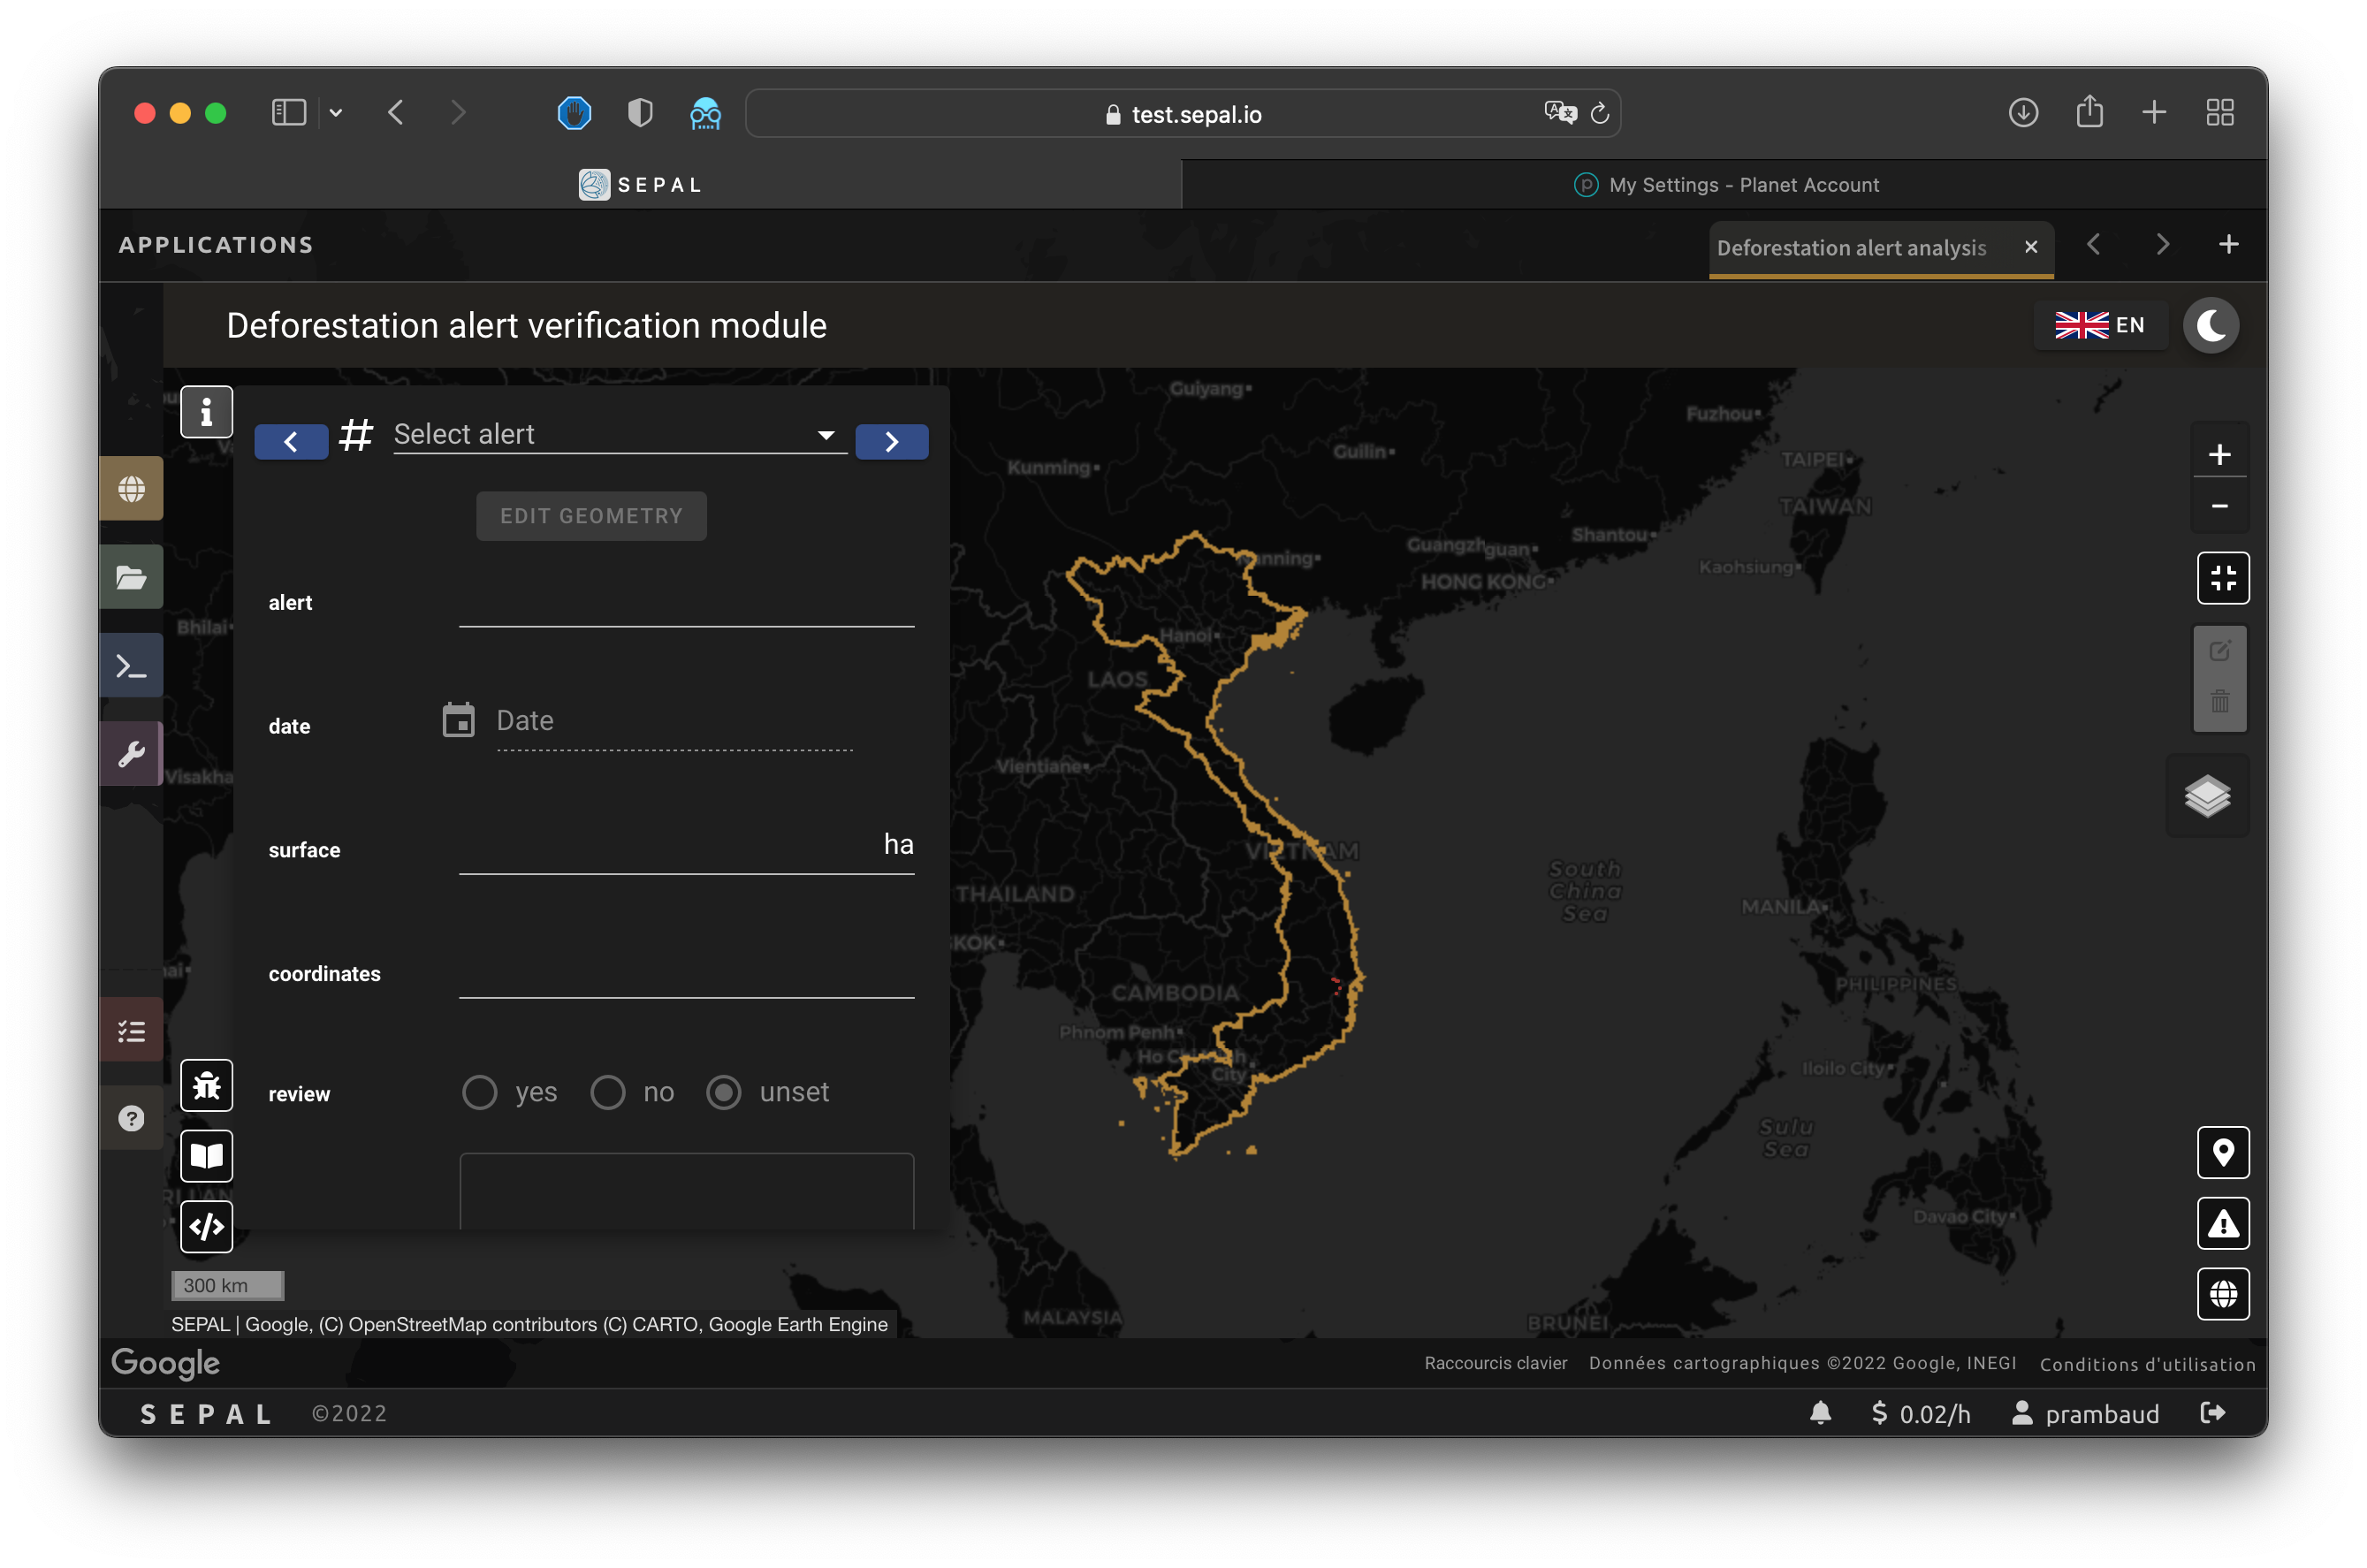
Alert ID#
In the upper section, the list of alerts are ordered by size. To access them, use the blue arrows or select the caret to select one in the dropdown menu. Once an alert is selected (represented now in orange on the map), the Planet pane will open itself in the upper-right corner of the map and the information associated with the alert will be displayed.
Tip
To move from one alert to another, click on the map to automatically load the relevant information.
Geometry edition#
Some drivers perform automatic analysis; sometimes the geometry of the alerts poorly represent what you see in the VHR imagery. By using this module, you can redefine the geometry before exporting your results to perfectly fit the deforested area.
Select edit geometry to open the Editing interface.
Select to start editing; move the white square to add or remove vertices.
To finish, select save to exit editing mode.
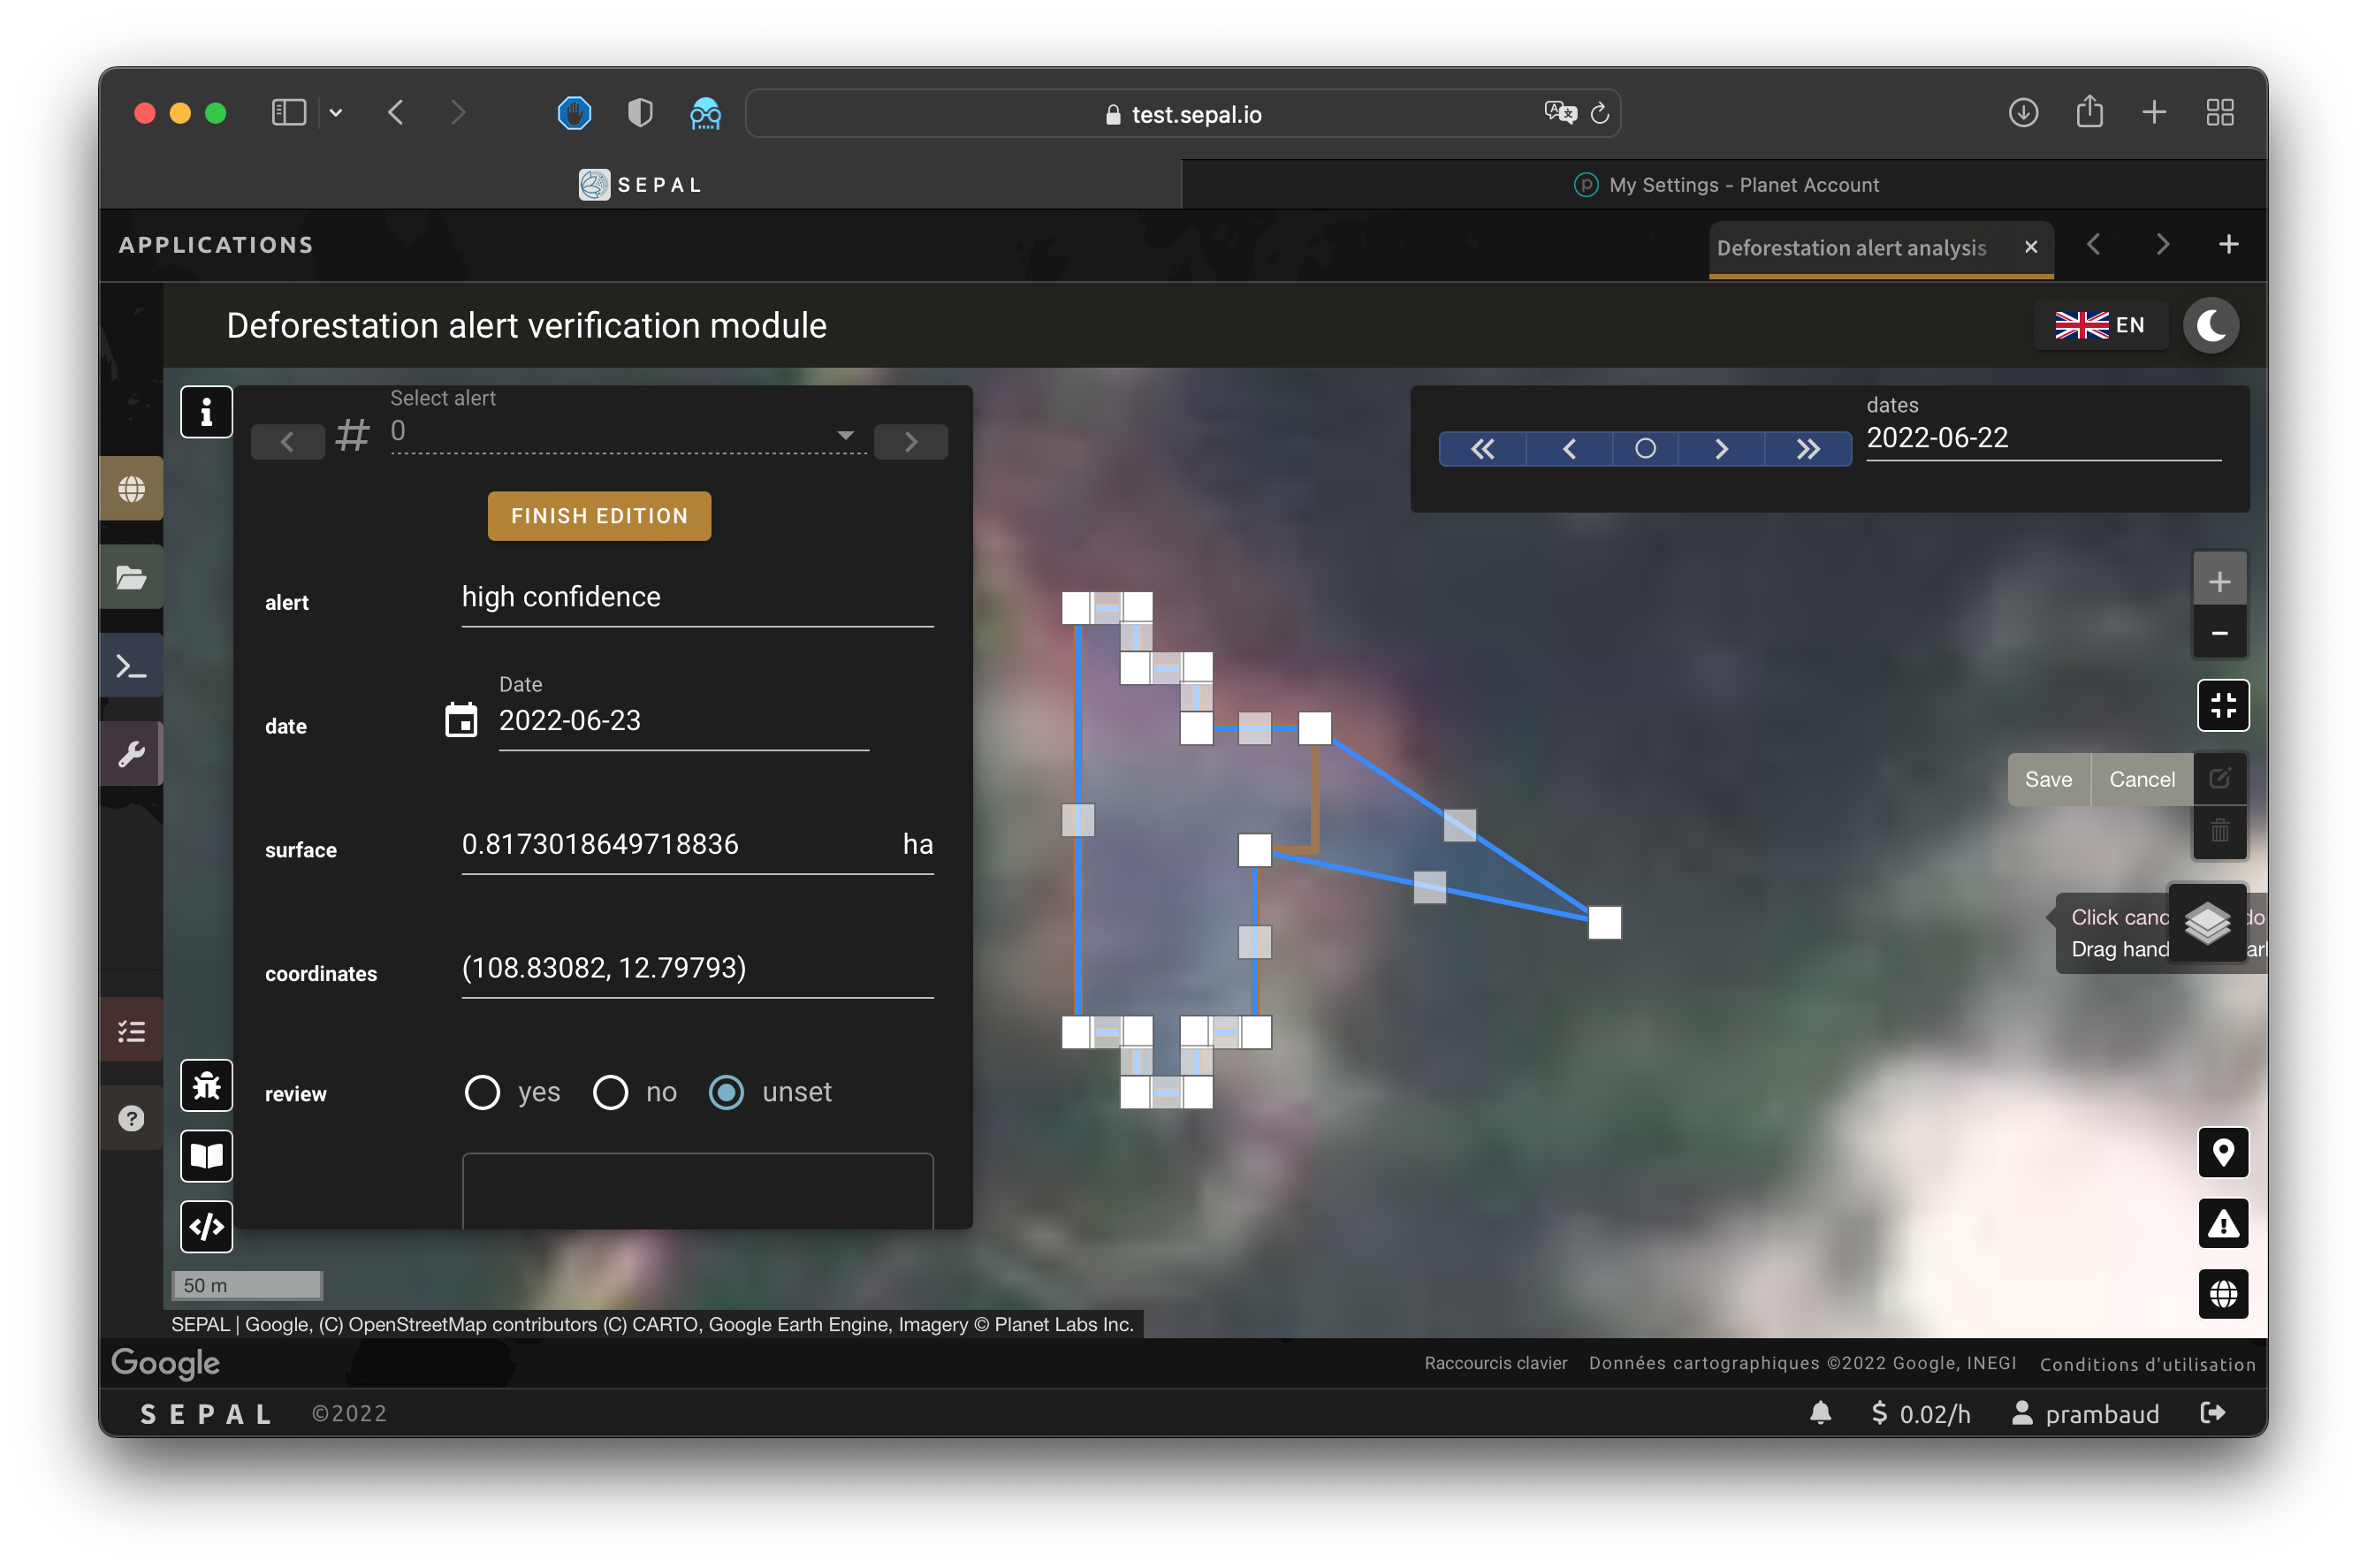
Alternatively:
Select to open the deletion interface.
Select clear all to remove the edited geometry; the geometry will return to its original state before editing.
Once editing is complete, select the finish edition button in the Metadata pane.
Date#
If the selected driver embeds the dates of the alerts, this field will be already completed with a meaningful date of a deforestation event; if it does not, use the date found in the file title.
Once the deforestation event is identified, update the date value to reflect what you see in the VHR imagery. Click in the field to use the date selector.
Review#
By default, all alerts are set to unset. After interpreting Planet imagery, change the value of the radio review to:
yes: the alert is valid, as well as the dateno: the alert is not valid (i.e. no deforestation event)unset: no review has been performed
Export#
In the lower portion of the Metadata pane, there are three exportation buttons; each one will export the alerts and their reviews in a specific format.
Export as .kml#
Export alerts as a .kml file, readable with Google Earth. Each alert will use its ID as the label. You can export them at the beginning of the review if you want to use Google Earth in the review process.
Export as .gpkg#
Export alerts as a .gpkg file, readable by any GIS software. It will embed the geometry and all properties associated with each feature/alert (including the original geometry). This file can be used to save progress and reused as an input of the process.
Export as .csv#
Export alerts as a .csv file. The properties of each alert are kept; the file represents each feature using the coordinates (latitude/longitude) of the centre of each alert.
Planet imagery#
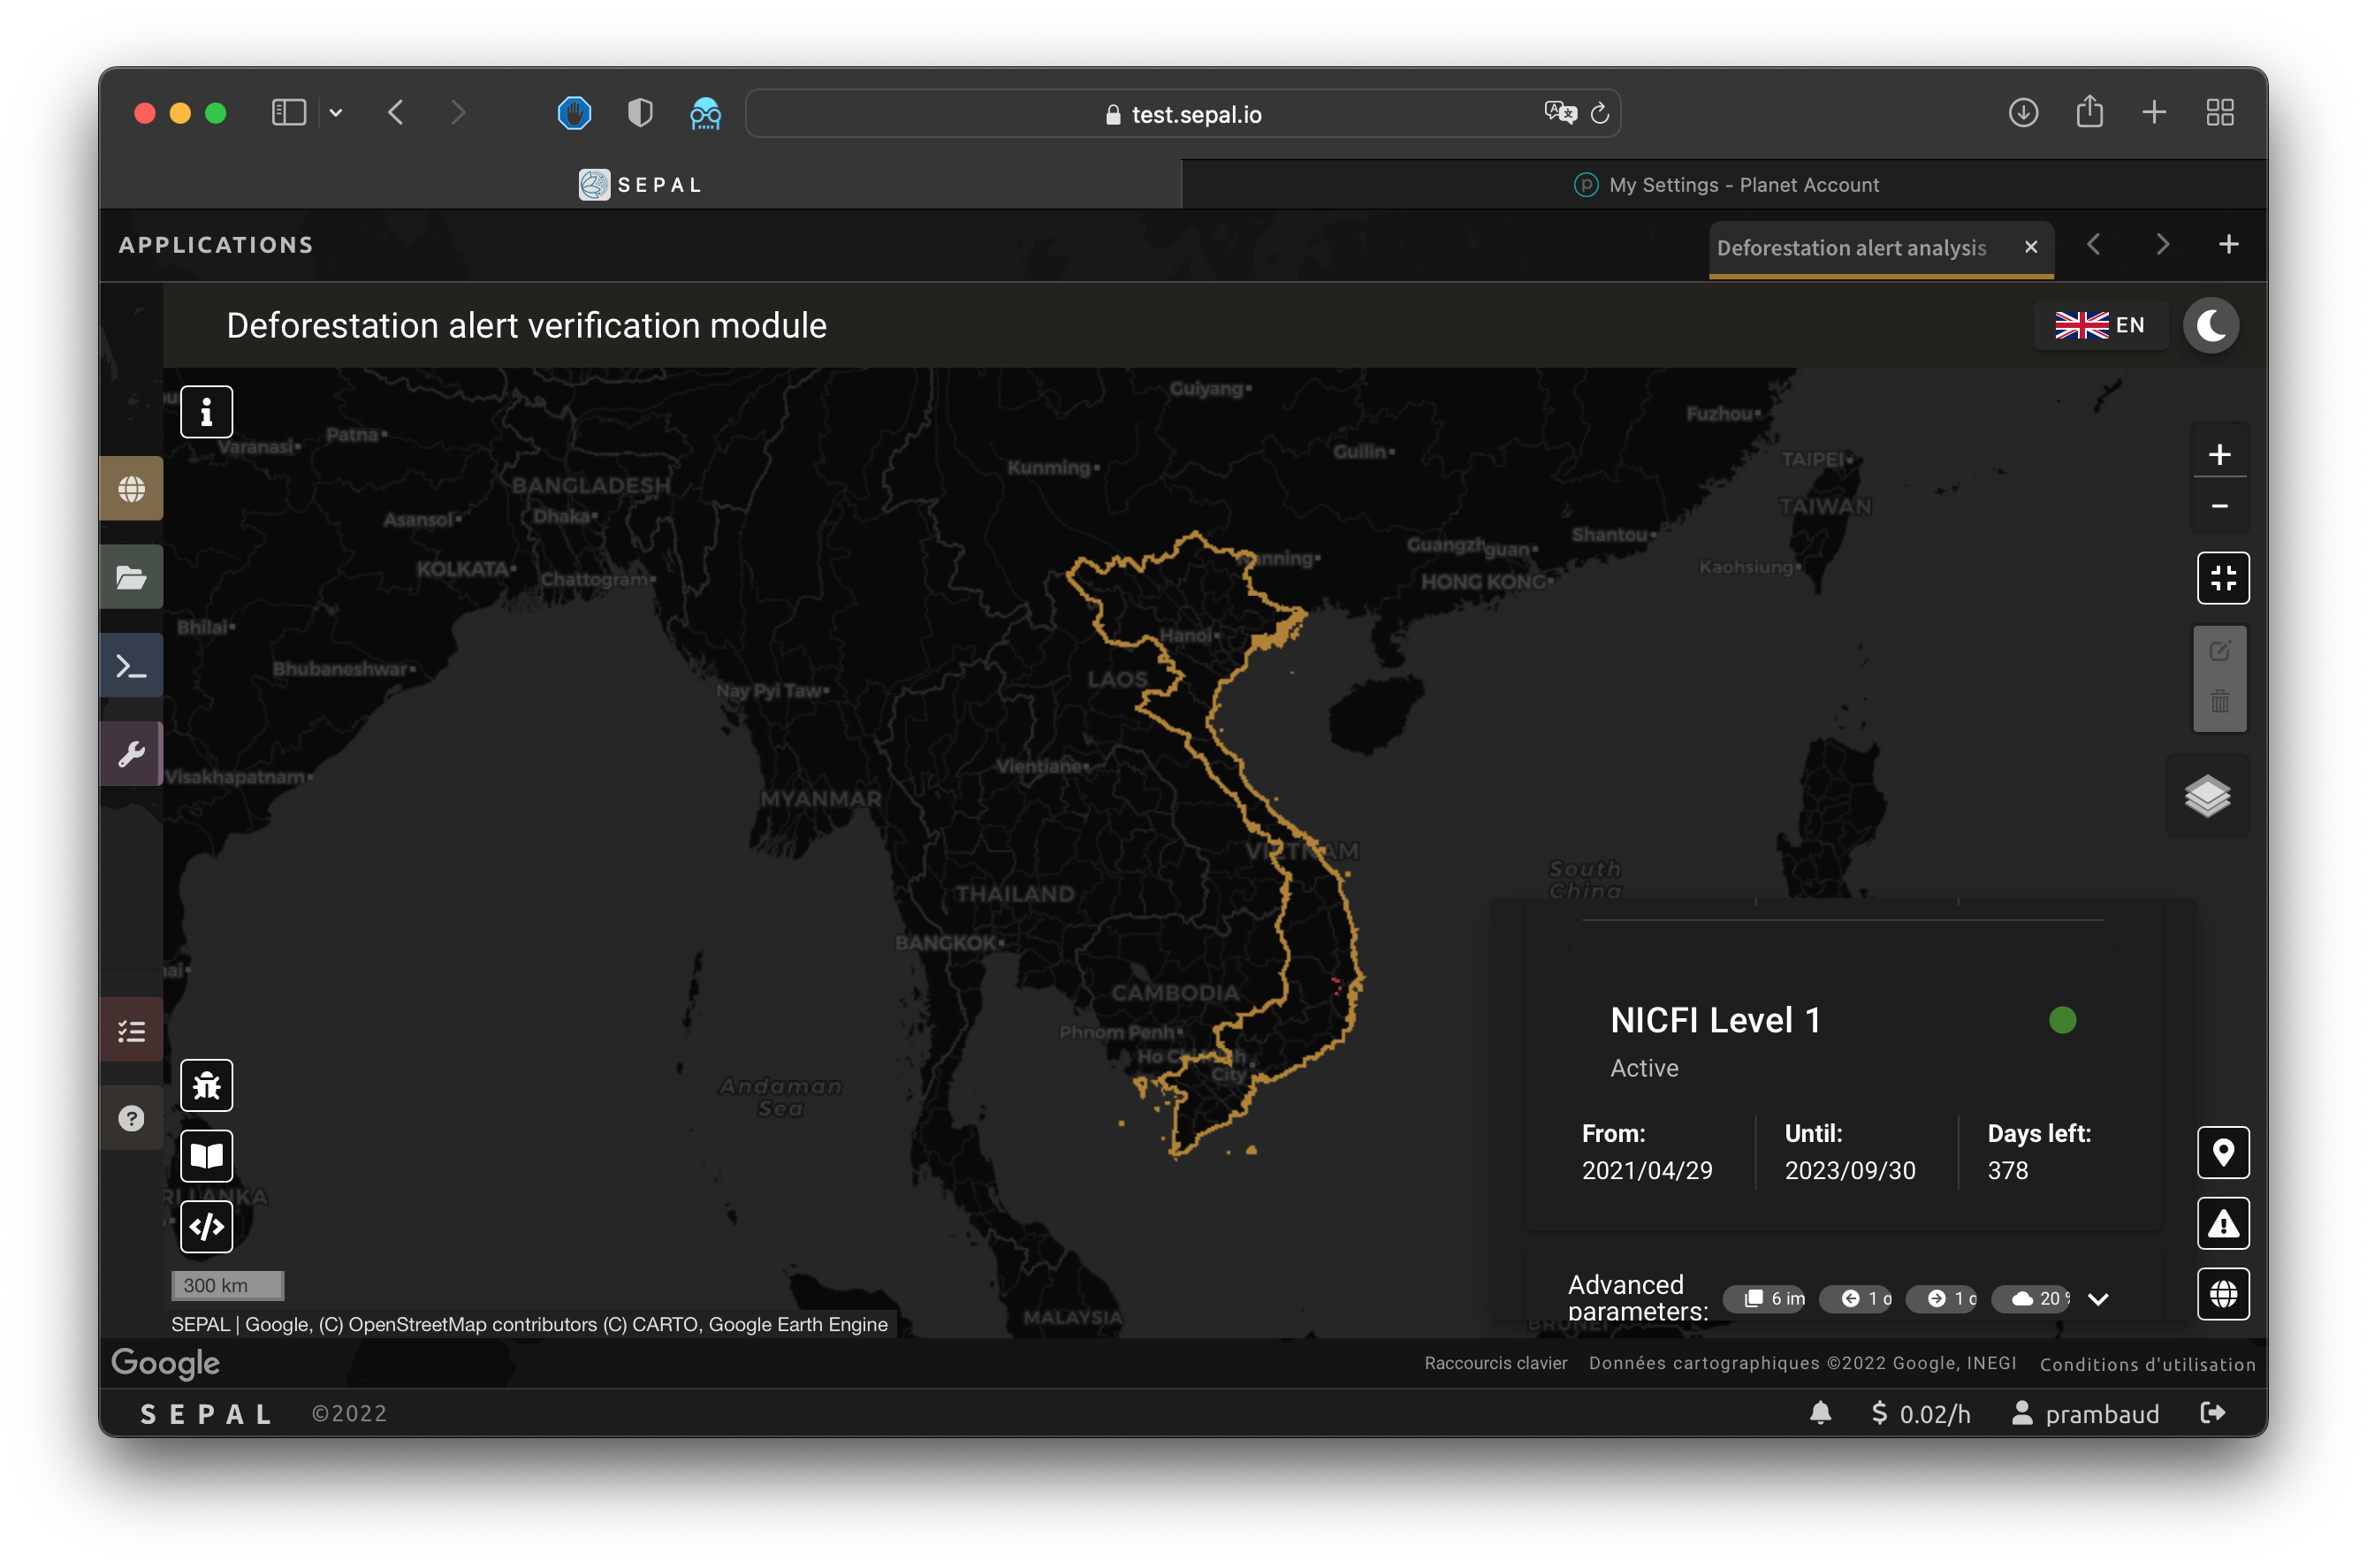
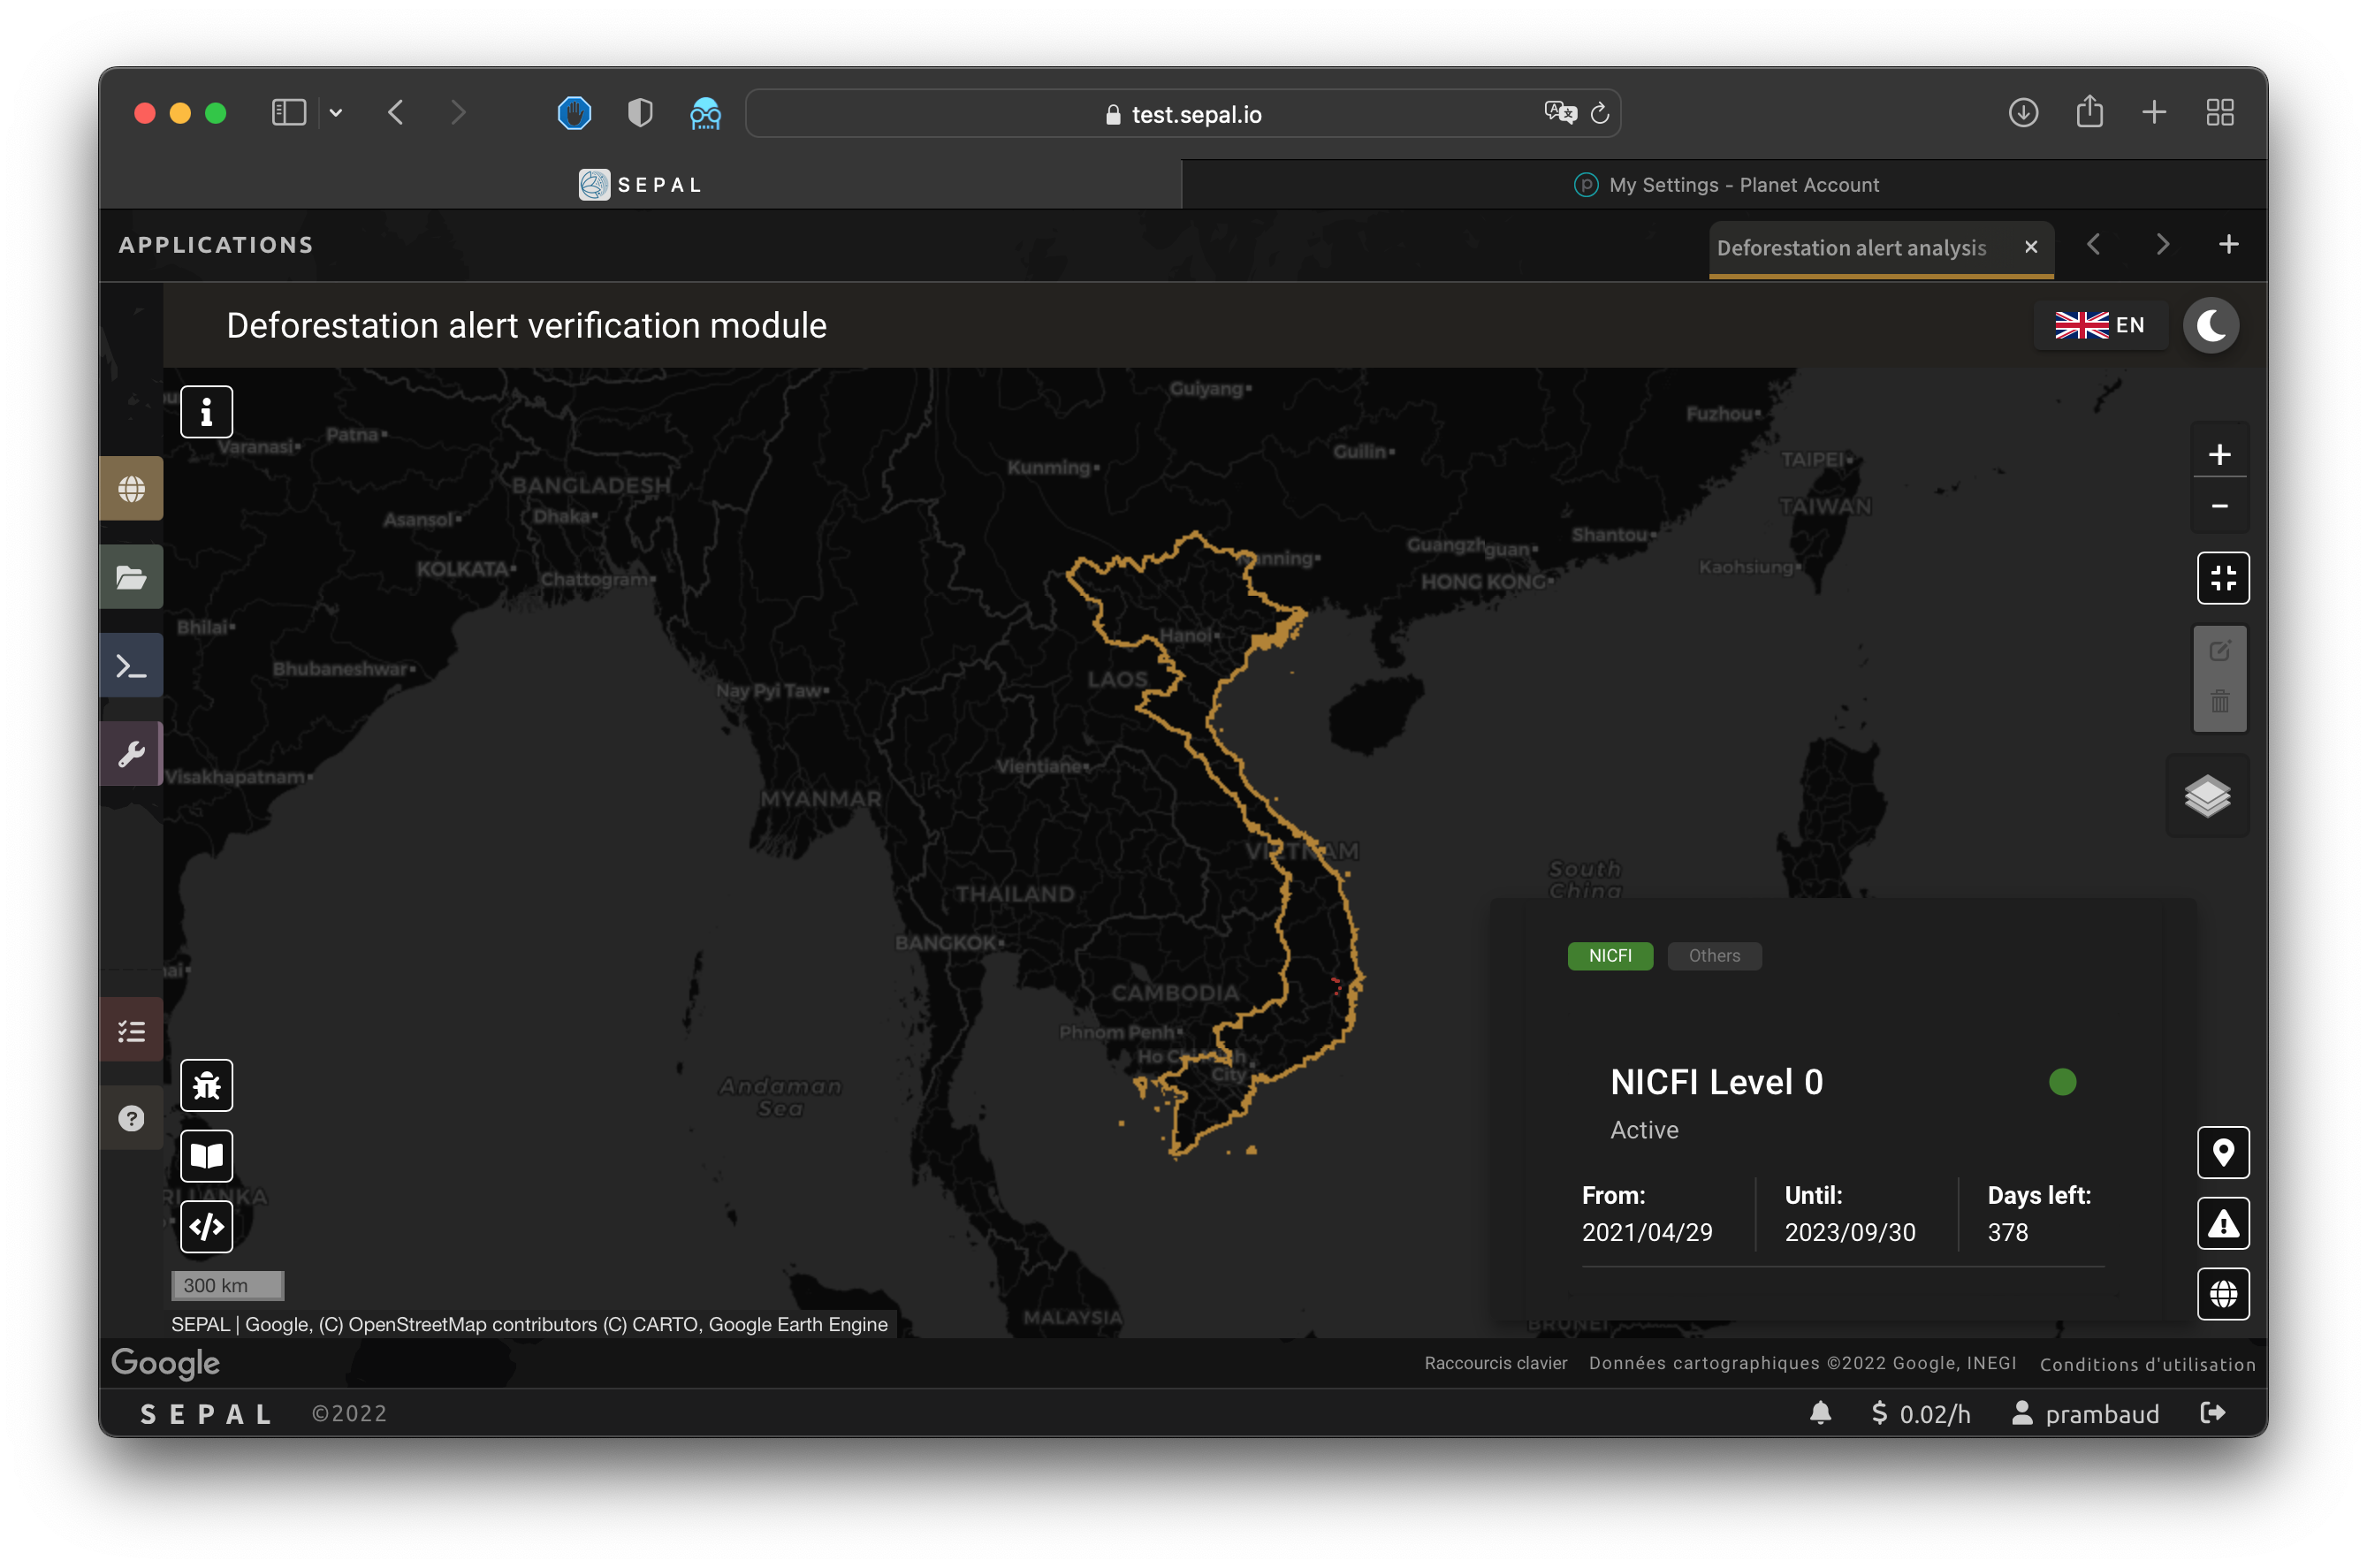
To interprete the validity of the alert, this module is based on NICFI – Planet imagery.
Parameters#
Note
This is optional. If nothing is set, the module will use Planet NICFI Level 1 data (monthly mosaics). If you have NICFI Level 2 access, providing your API key will grant you access to daily imagery.
Select to access the Planet API interface. In this pane, you can connect to your Planet profile using your credentials or your password.
Select credential mode (between Credentials” and **API key)
Set and validate your credentials
If the icon is green, you are connected.
Select NICFI to see the details of subscriptions available with your profile. If Level 2 data are accessible, you will be granted access to daily imagery for the reviewing steps.

Advanced parameters#
Once validated, you’ll be able to modify Planet advanced parameters. These parameters are used to request images to Planet; some default parameters have been set, but making changes may improve the readability of the image.
Number of images: Maximum number of images to display on the map (defaults to six).
Day before: Number of the previous day that the interface can search for images; useful when there is a lot of cloud coverage (defaults to one).
Day after: Number of the previous day that the interface can search for images; useful when there is a lot of cloud coverage (defaults to one).
Cloud coverage: The requested maximum cloud coverage of the images (defaults to 20 percent).

Level 1 (monthly)#
Level 1 data are monthly mosaics. When an alert is selected, the module will load the closest month from the observation date. The user can then use the Planet navigator to change the displayed image.
Select to change the color of the images from CIR to RGB. The user can select the monthly mosaic directly from the dropdown menu or use the navigation buttons. The and buttons will move one month into the past and future. The will set on the closest date from the observation date.

Level 2 (daily)#
Note
This option is only available for users that have NICFI Level 2 access.
Level 2 data are daily imagery. When an alert is selected, the module will load the closest day from the observation date and display images using the advanced parameters provided by the user.
Tip
Since multiple images are displayed at once, don’t hesitate to play with the Layer control to hide and show different scenes.
Navigate through the images using the buttons in the Planet navigator. Use and to move one day at a time into the past or future. Use and to move one month at a time into the past or future). The button will set the closest date from the observation date.
Comments#
You can fill out this comment section with any aditional information. There are no size limits.