Clip time series#
Download an automatically generated time series from customizable dates as a .pdf file
This module allows users to download an automatically generated time series from customizable dates as a .pdf. Each mosaic will be represented as a custom square around the point of interest using the band combination selected by the user (ranging in size from 500 m x 500 m to 1000 km x 10000 km).
Note
This article should explain every step to execute the module. However, if you encounter a problem, please report it.
Select file#
First, select a file to be the main input of the module. Each page of the final .pdf will match a geometric shape of the input. The user can use two types of inputs:
Table file (
.csv,.txt) containing at least coordinates and ID columnsShapes (
.geojson,.shp,.geopackage) with at least geometry and ID columns
Table#
Select the point radio button.
The table file can be a .csv or .txt file. It needs to have at least three columns, including the latitude coordinates, the longitude coordinates and an ID. There are no restrictions for column names.
Attention
The table coordinates need to remain unprojected (i.e. in EPSG:4326).
Select Table file. Only the matching file type will be displayed. Navigate through your SEPAL folders to find the appropriate table.
Once a file is selected, the widget will try to autopopulate the ID, latitude and longitude columns. If columns are incorrectly set or if data are missing, select one of the File columns to completely describe the points (x, y, ID).
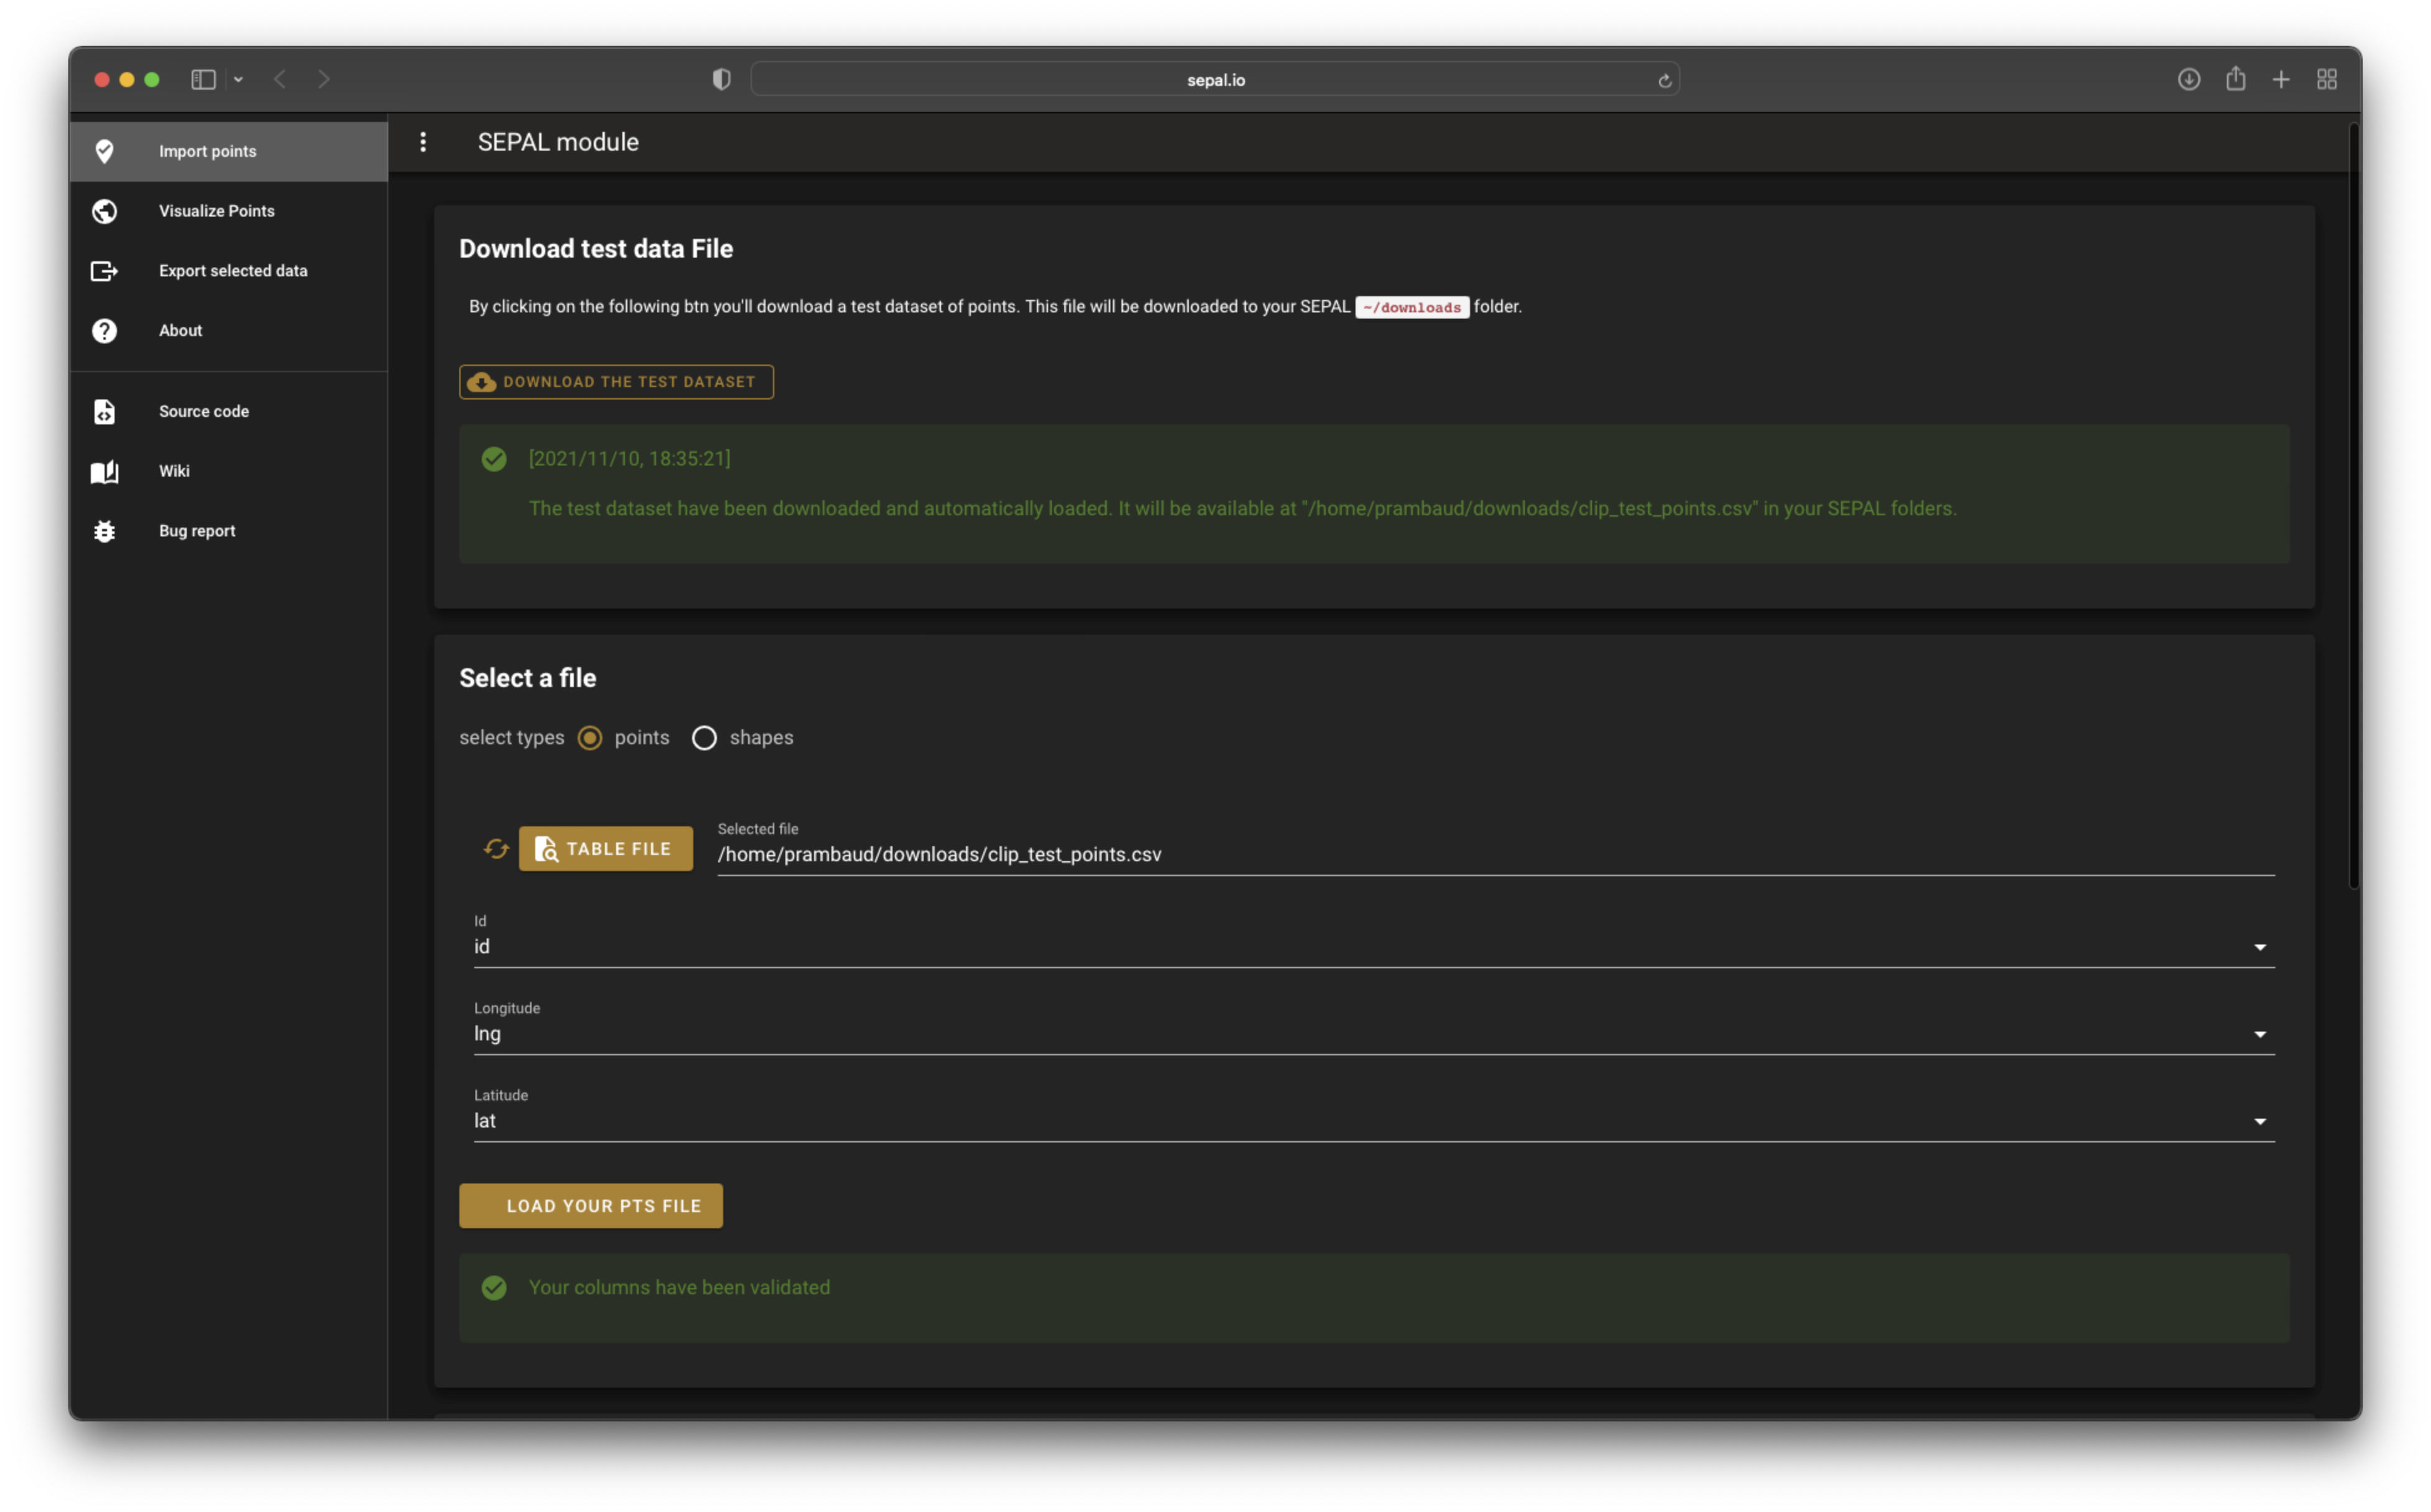
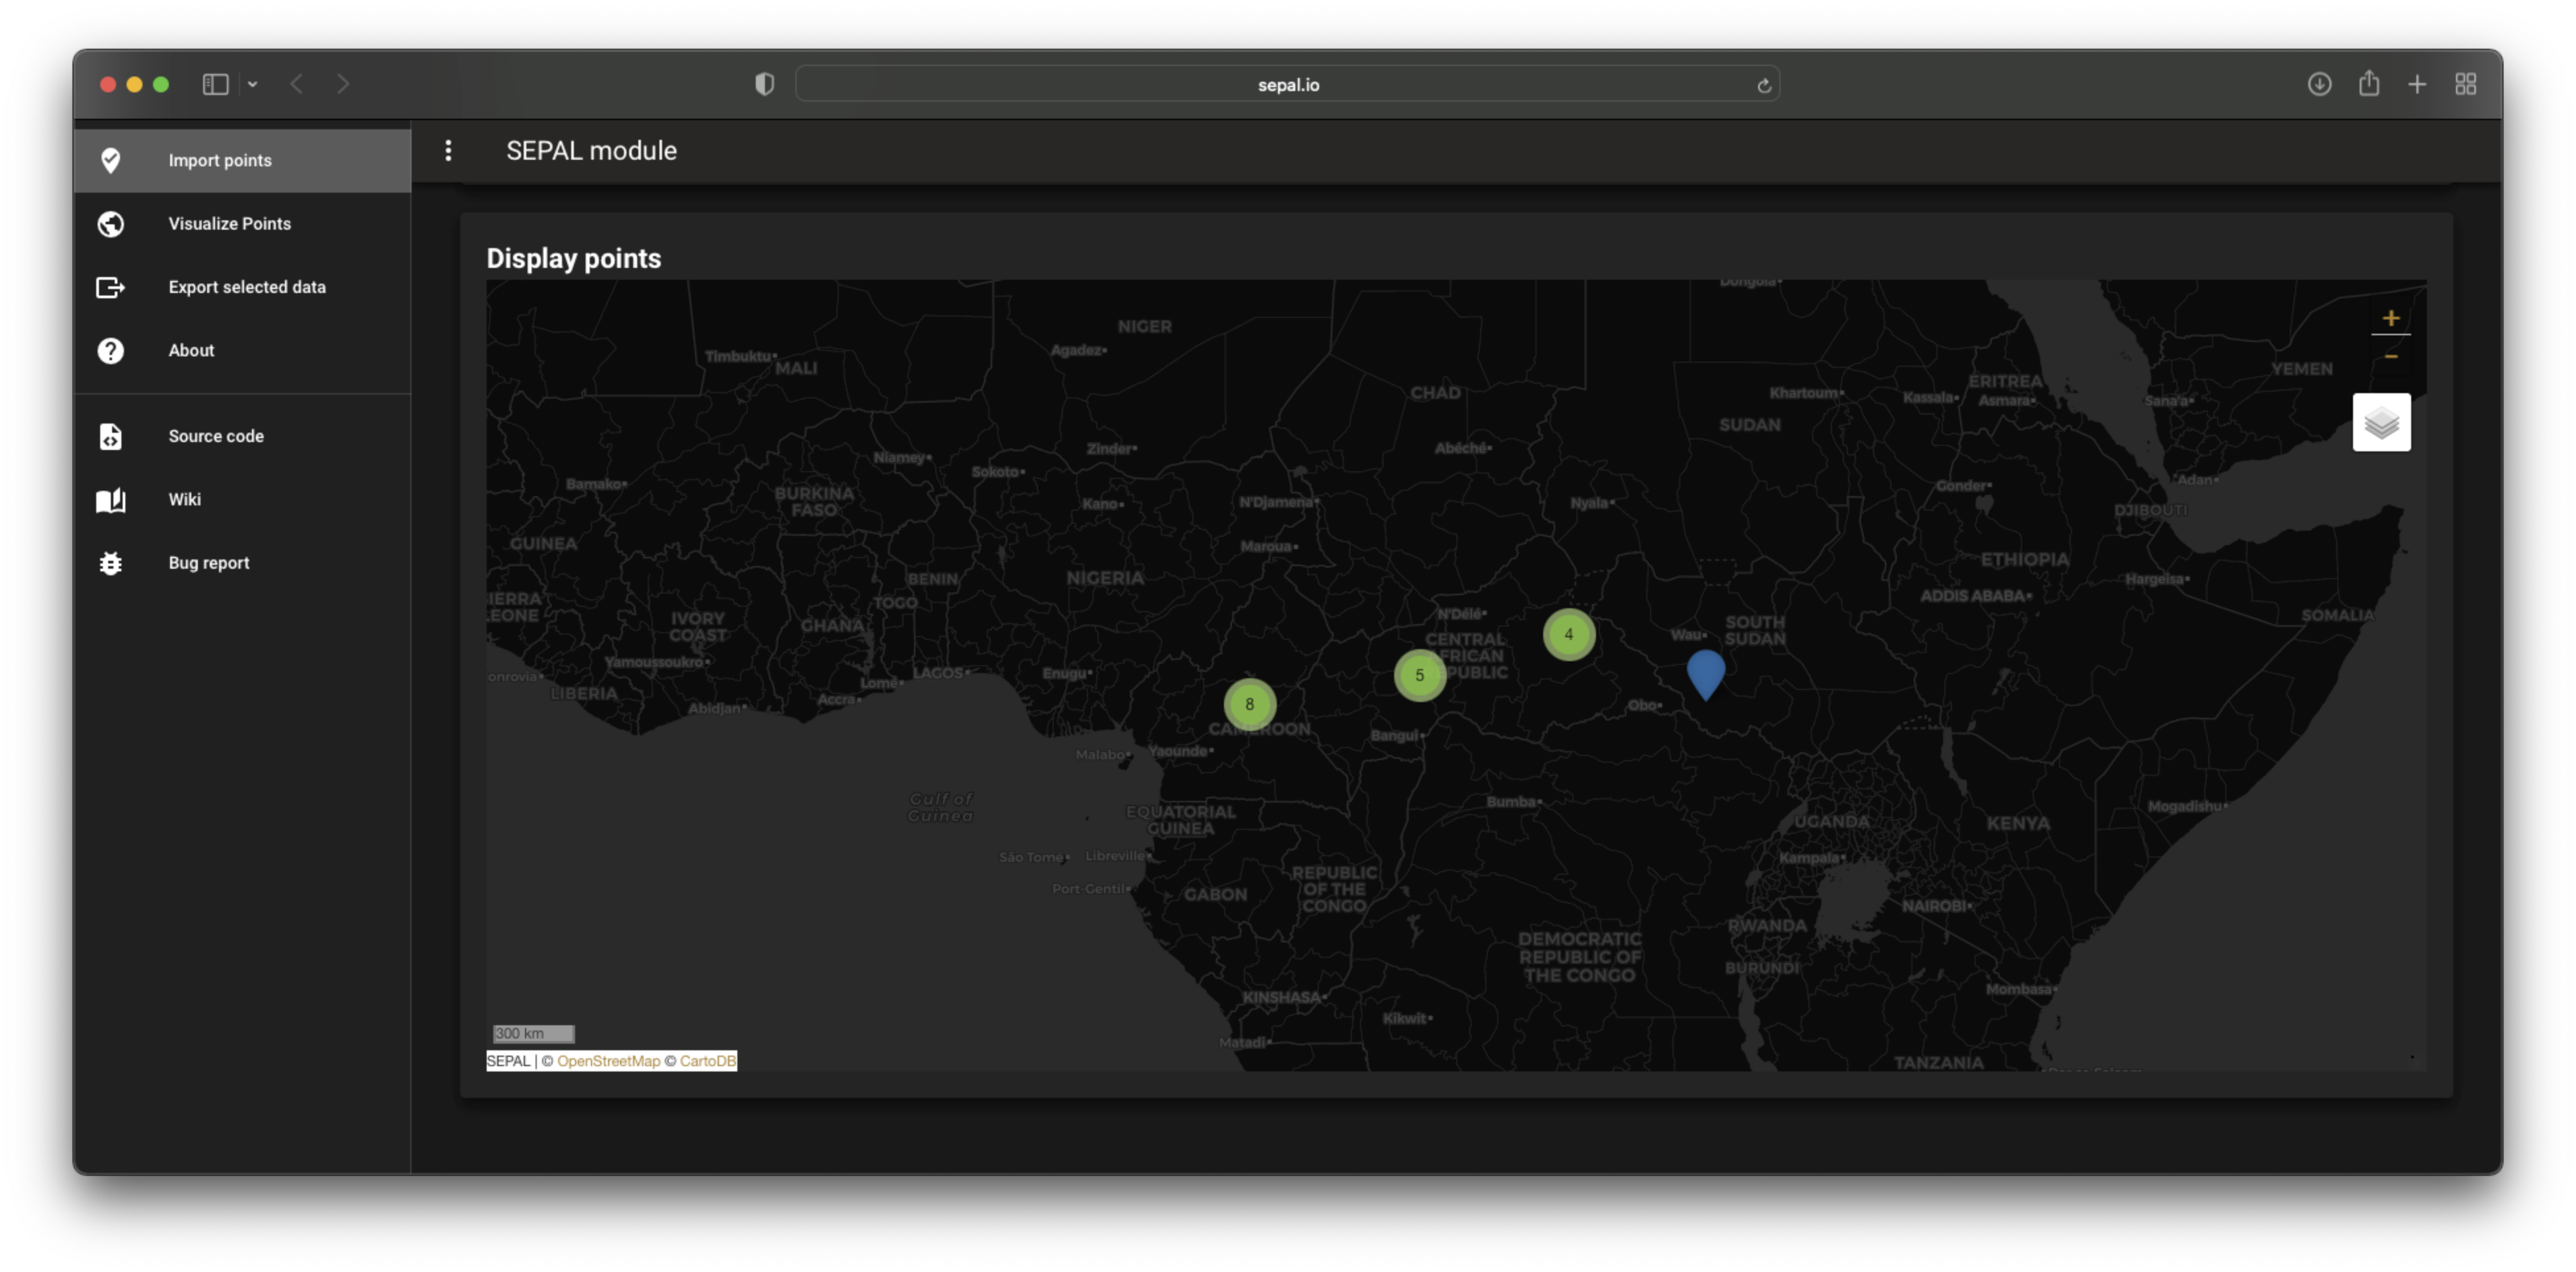
Select load your pts file to load the points as a geodataframe in the app model and display them on a map.
The points will be represented as marker clusters and the map will automatically zoom in on them; click on any cluster to zoom in.
Tip
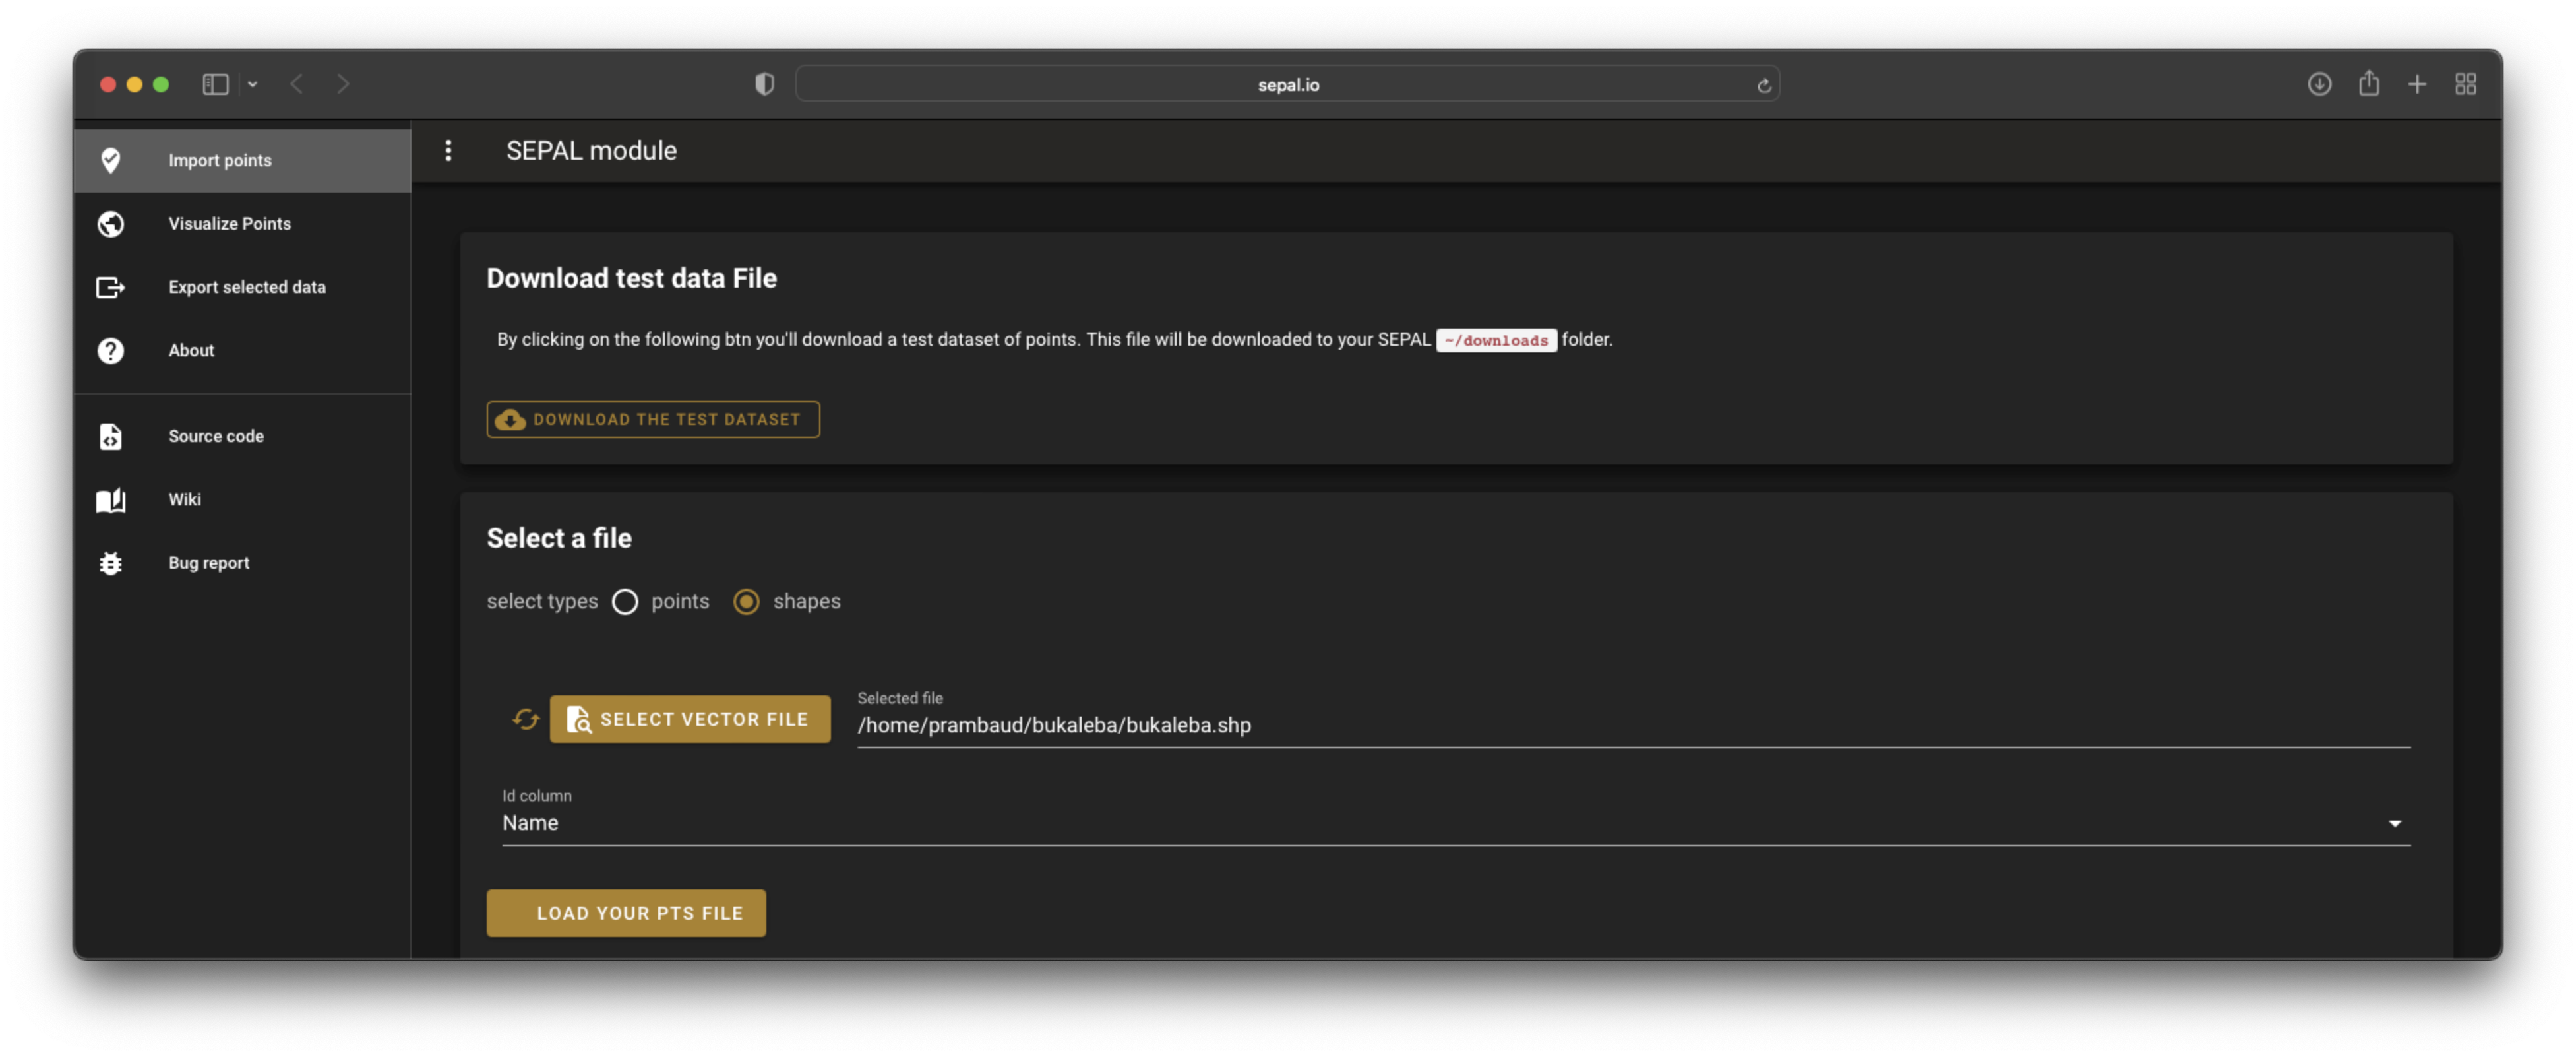
Select :guilabel:` download test dataset` to automatically download and validate a set of points in the app, which can be used to discover module functionalities.
Shape#
Select the shape radio button.
The table file can be any file type digested by the fiona library; the file needs to have at least one column to describe the ID.
The ID column will be used to name the points in the final .pdf. Select it in the updated dropdown menu, ID column.
Attention
If you use names for IDs, make sure they are unique.
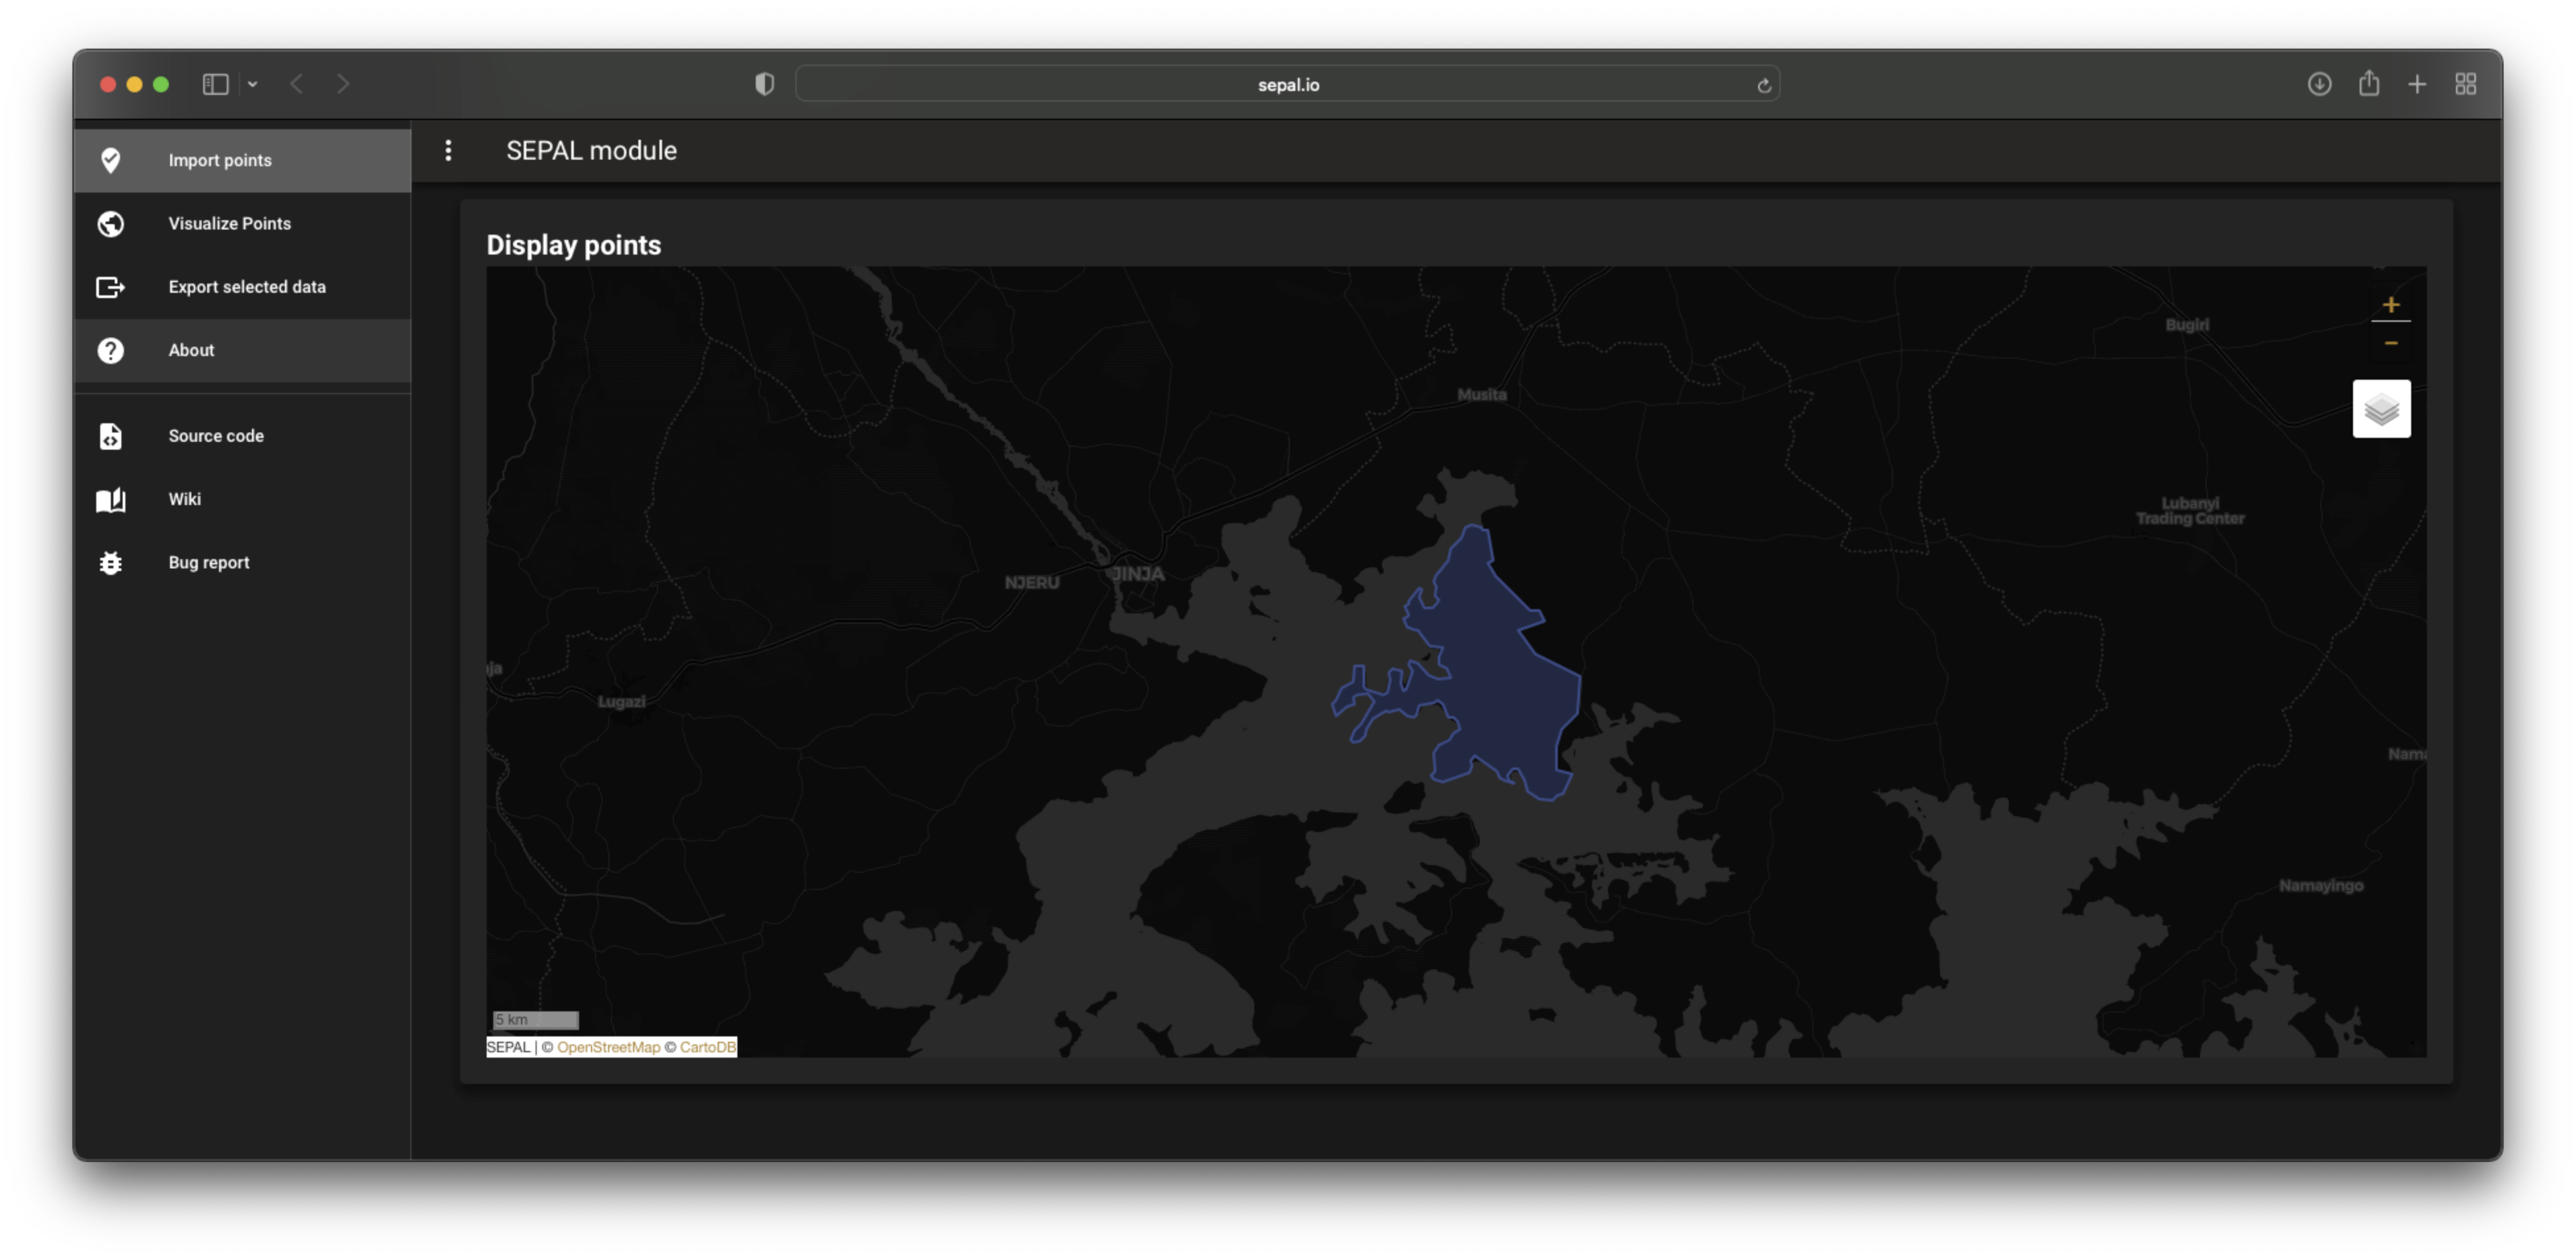
Select load your pts file to load the shapes as a geodataframe in the app model and display them on a map. The map will be updated with the selected shapes and zoom in on the AOI.
Select time series parameters#
In this second step, you will select the parameters of your time series.
Drivers#
Two drivers are available in this module. You can select either:
GEE-based computation (images will be retreived from GEE), or
Planet (images will be retrieved from Planet servers using the user API key).
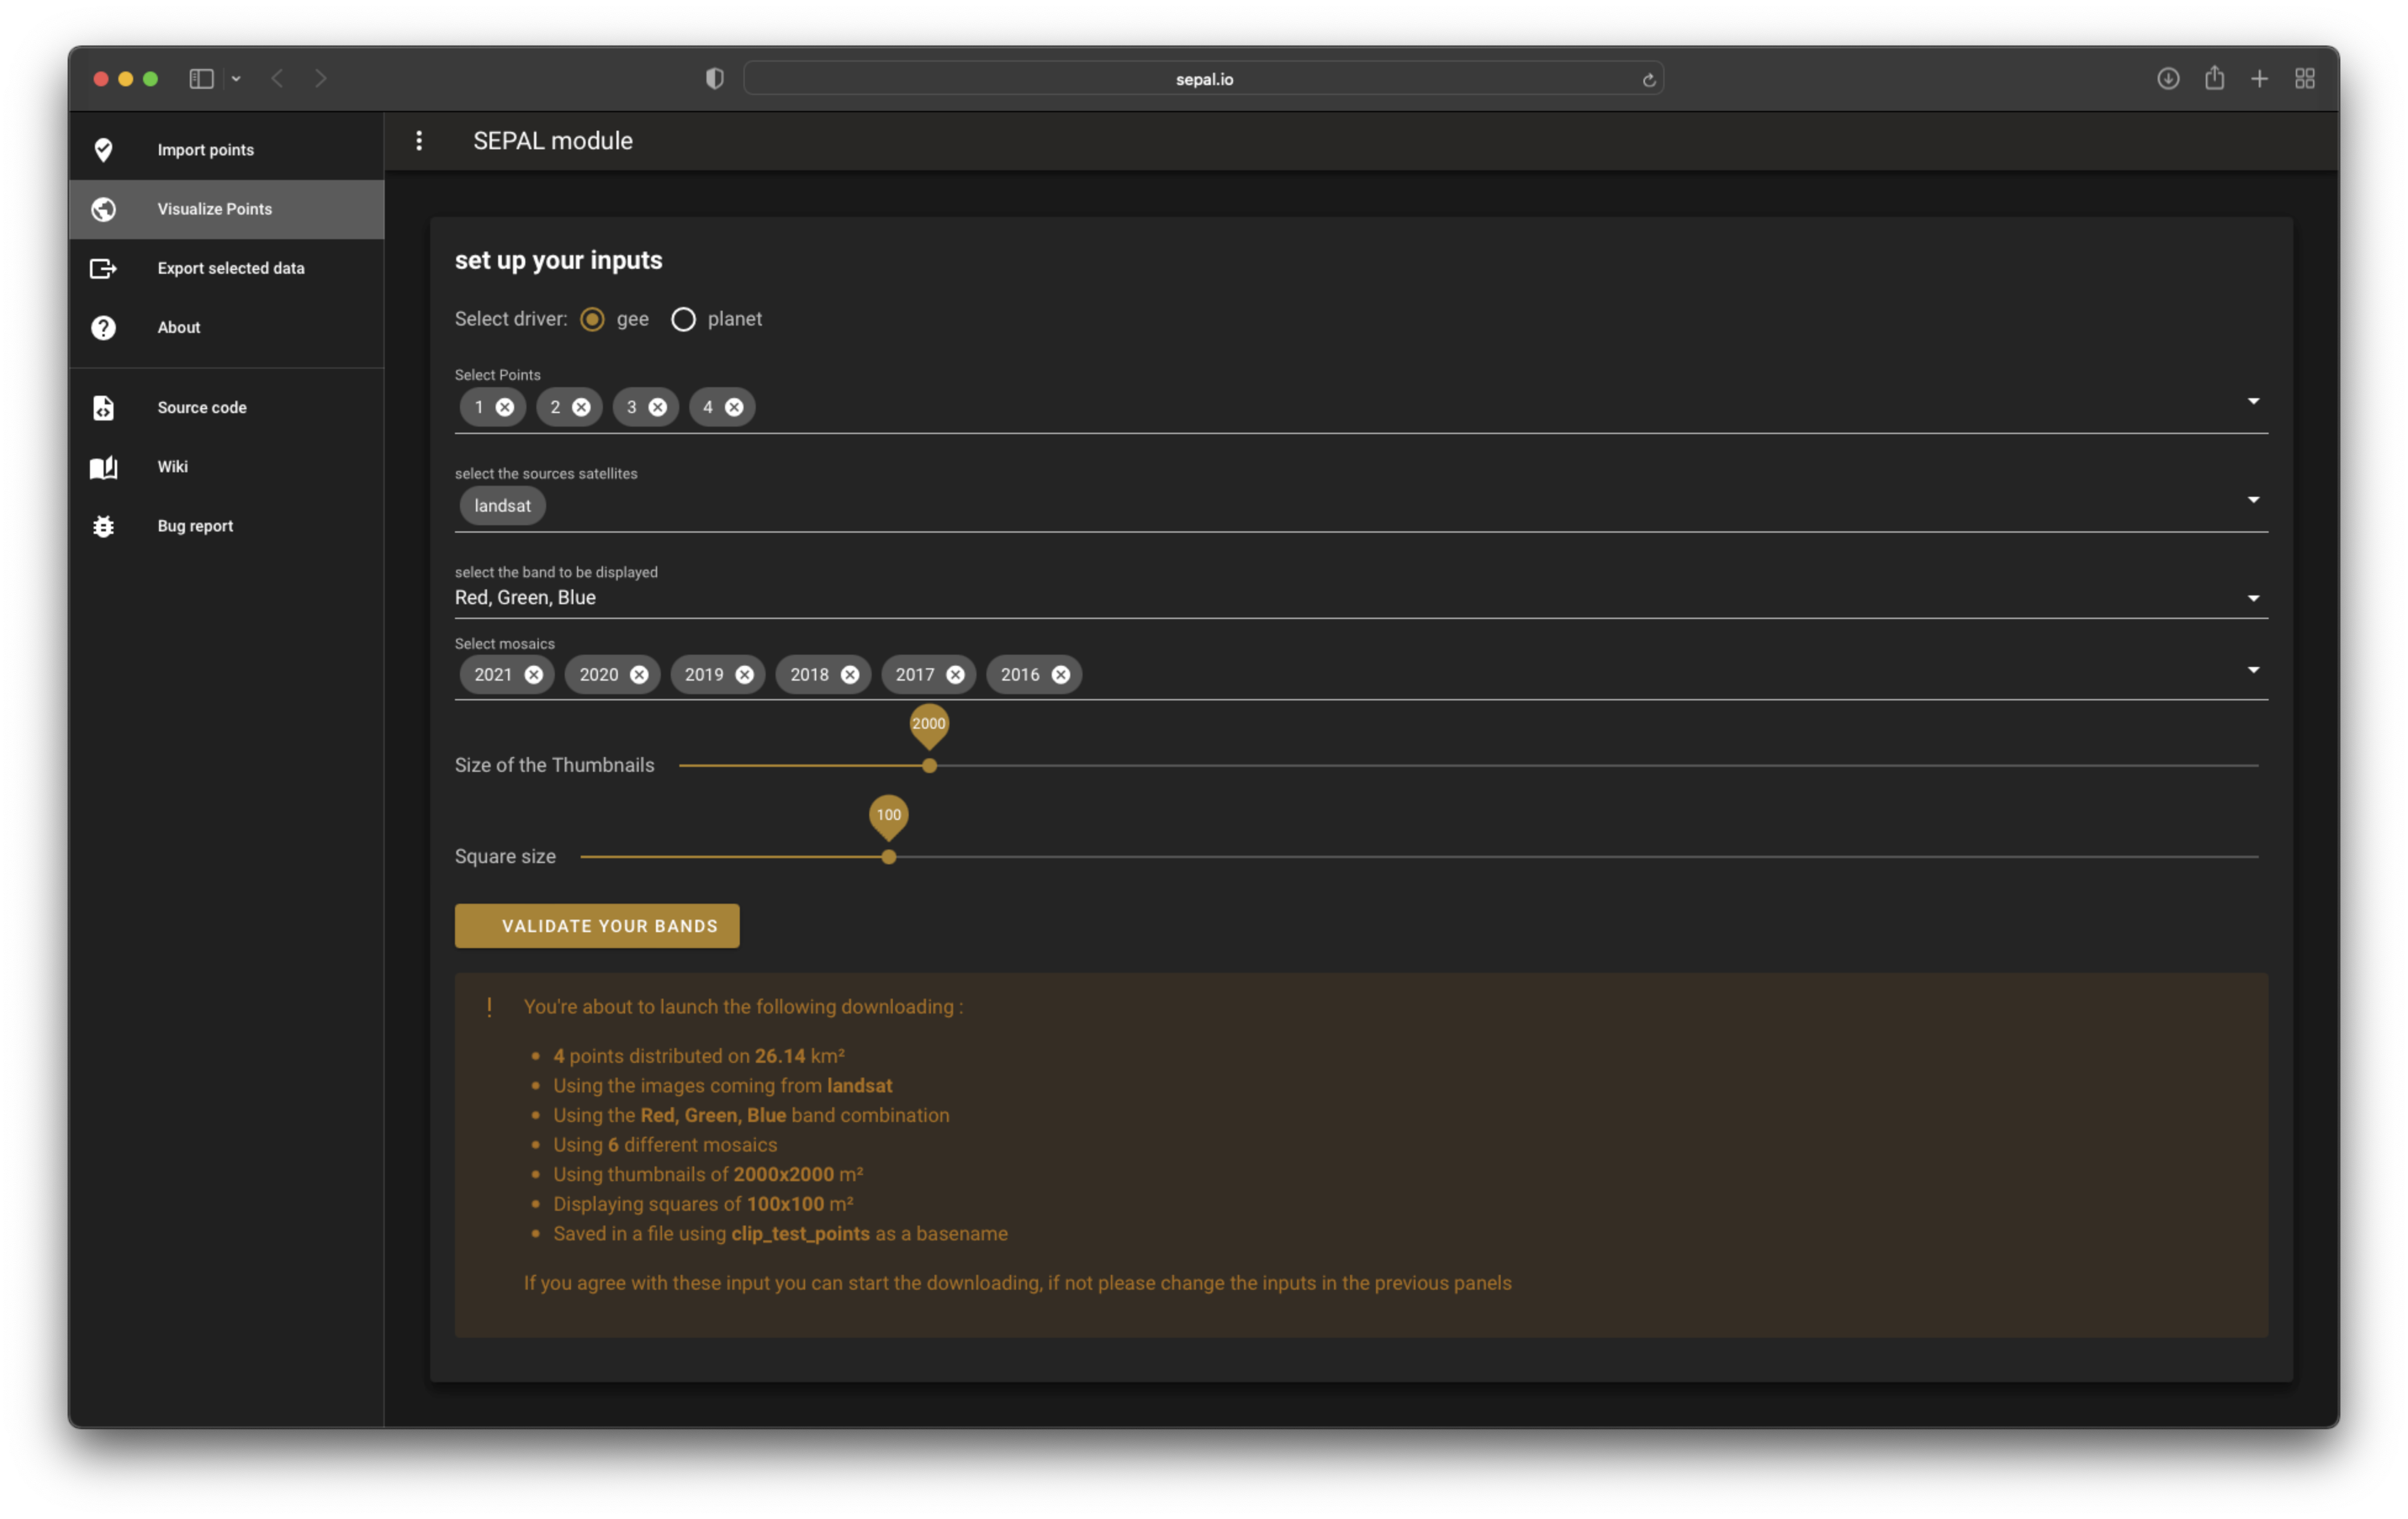
If the user selects gee, the panel will ask you to select the satellites to use for thumbnails. Select any satellite imagery from the Landsat family and Sentinel programme.
The best available image is then selected using the following hierarchical order:
Sentinel 2
Landsat 8
Landsat 5
Landsat 7
If the user selects planet, the pane will ask for the Planet API key.
Points#
The number of points a user wants to display can vary. If the user selects all, all available points in the provided file will be used. It’s also possible to select a subset of them using their ID names.
Bands#
Multiple band combinations can be selected:
Using the
geedriver:Red, Green, Blue
Nir, Red, Green
Nir, Swir1, Red
Swir2, Nir, Red
Swir2, Swir1, Red
Swir2, Nir, Green
Using the
planetdriver:rgb
cir
Mosaics#
Each selected mosaic will be represented by a thumbnail in the final pdf.
Attention
Users can select as many mosaics as they want, but please note:
The page will remain in A4 format, so thumbnails will become smaller and smaller, proportional to the number of mosaics.
Each image needs to be downloaded to SEPAL, so many images result in a longer computation time.
Using the gee driver, mosaics are yearly cloudless mosaics built on the best satellites, as described in the previous section.
Using the planet driver, three types of mosaics can be selected (and mixed together):
NICFI biannual mosaics
NICFI monthly mosaics
Other (any other mosaics associated with the user API key)
Thumbnails#
Select a thumbnail size, which will be the minimum size of the thumbnail used. If the shape defined in the first pane is bigger, the software will try to find the smallest square around the shape, centred on its centroid.
Attention
If the final outer square of a shape is larger than 10000 km x 10000 km, GEE and Planet will refuse to export your data. Remember that this module is not meant to export national time series but thumbnails.
Square size#
In the middle of the final image, the software will display a small square to visually represent the point. Users can select the size of this square depending on the size of their thumbnails.
If the used dataset is a shapefile, the square will be replaced by shape geometry.
When selecting the Validation button, the module provides a summary of the download (a warning step to avoid downloading massive numbers of points on incorrectly defined parameters).
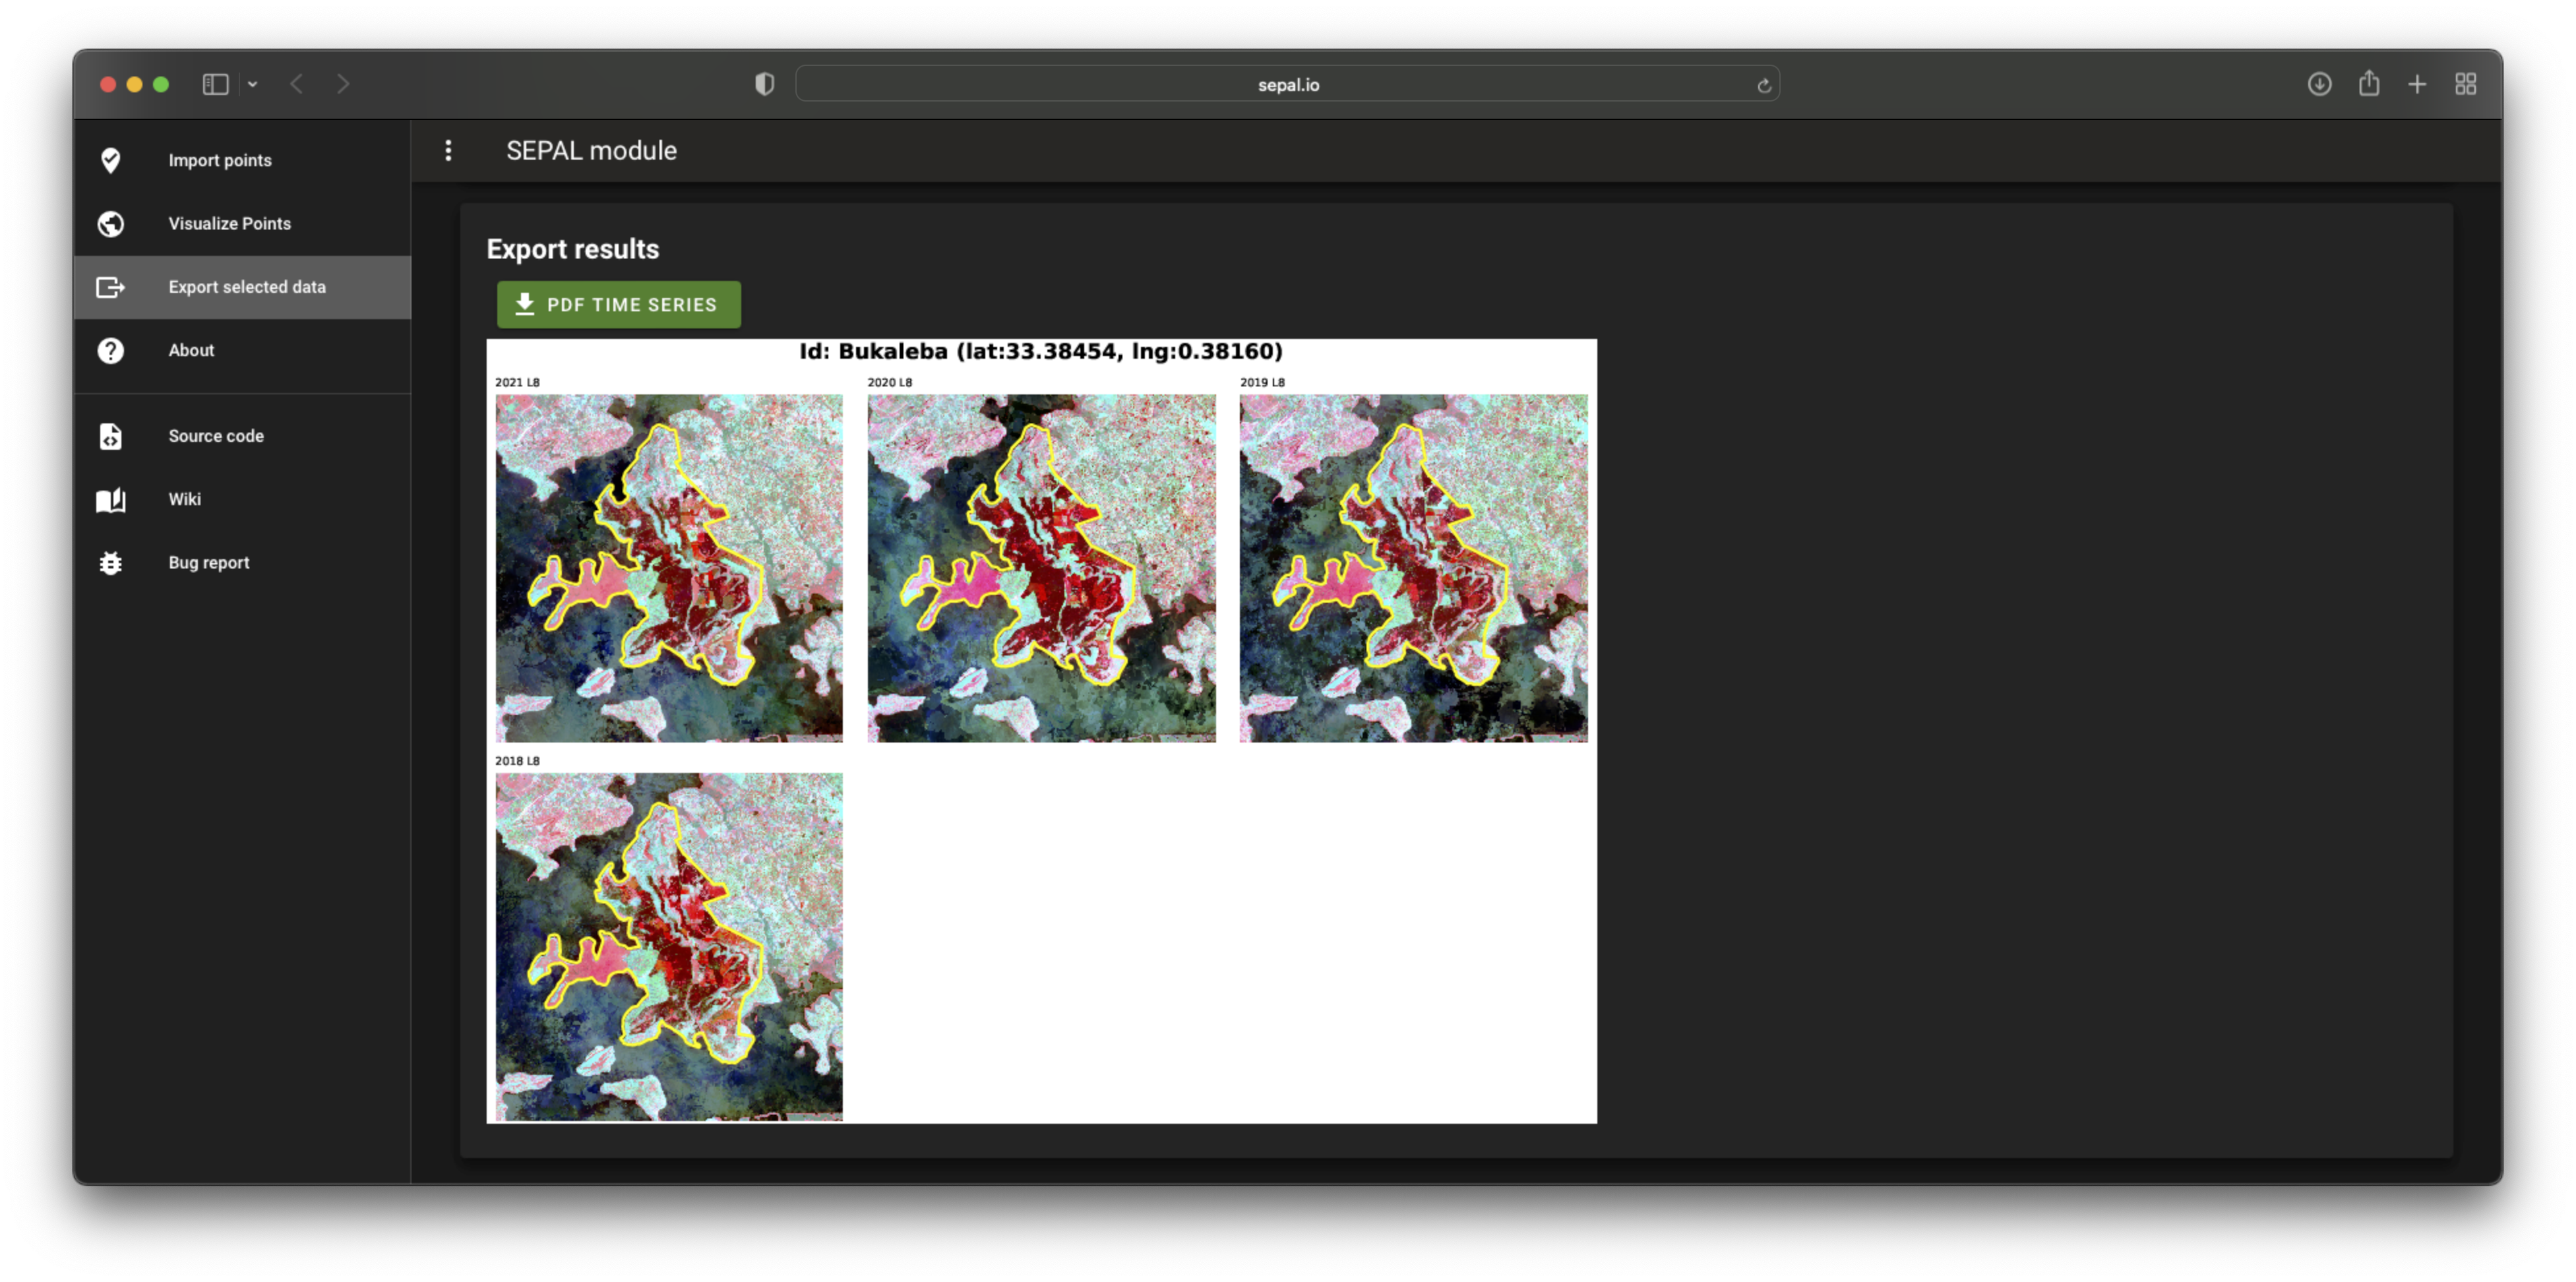
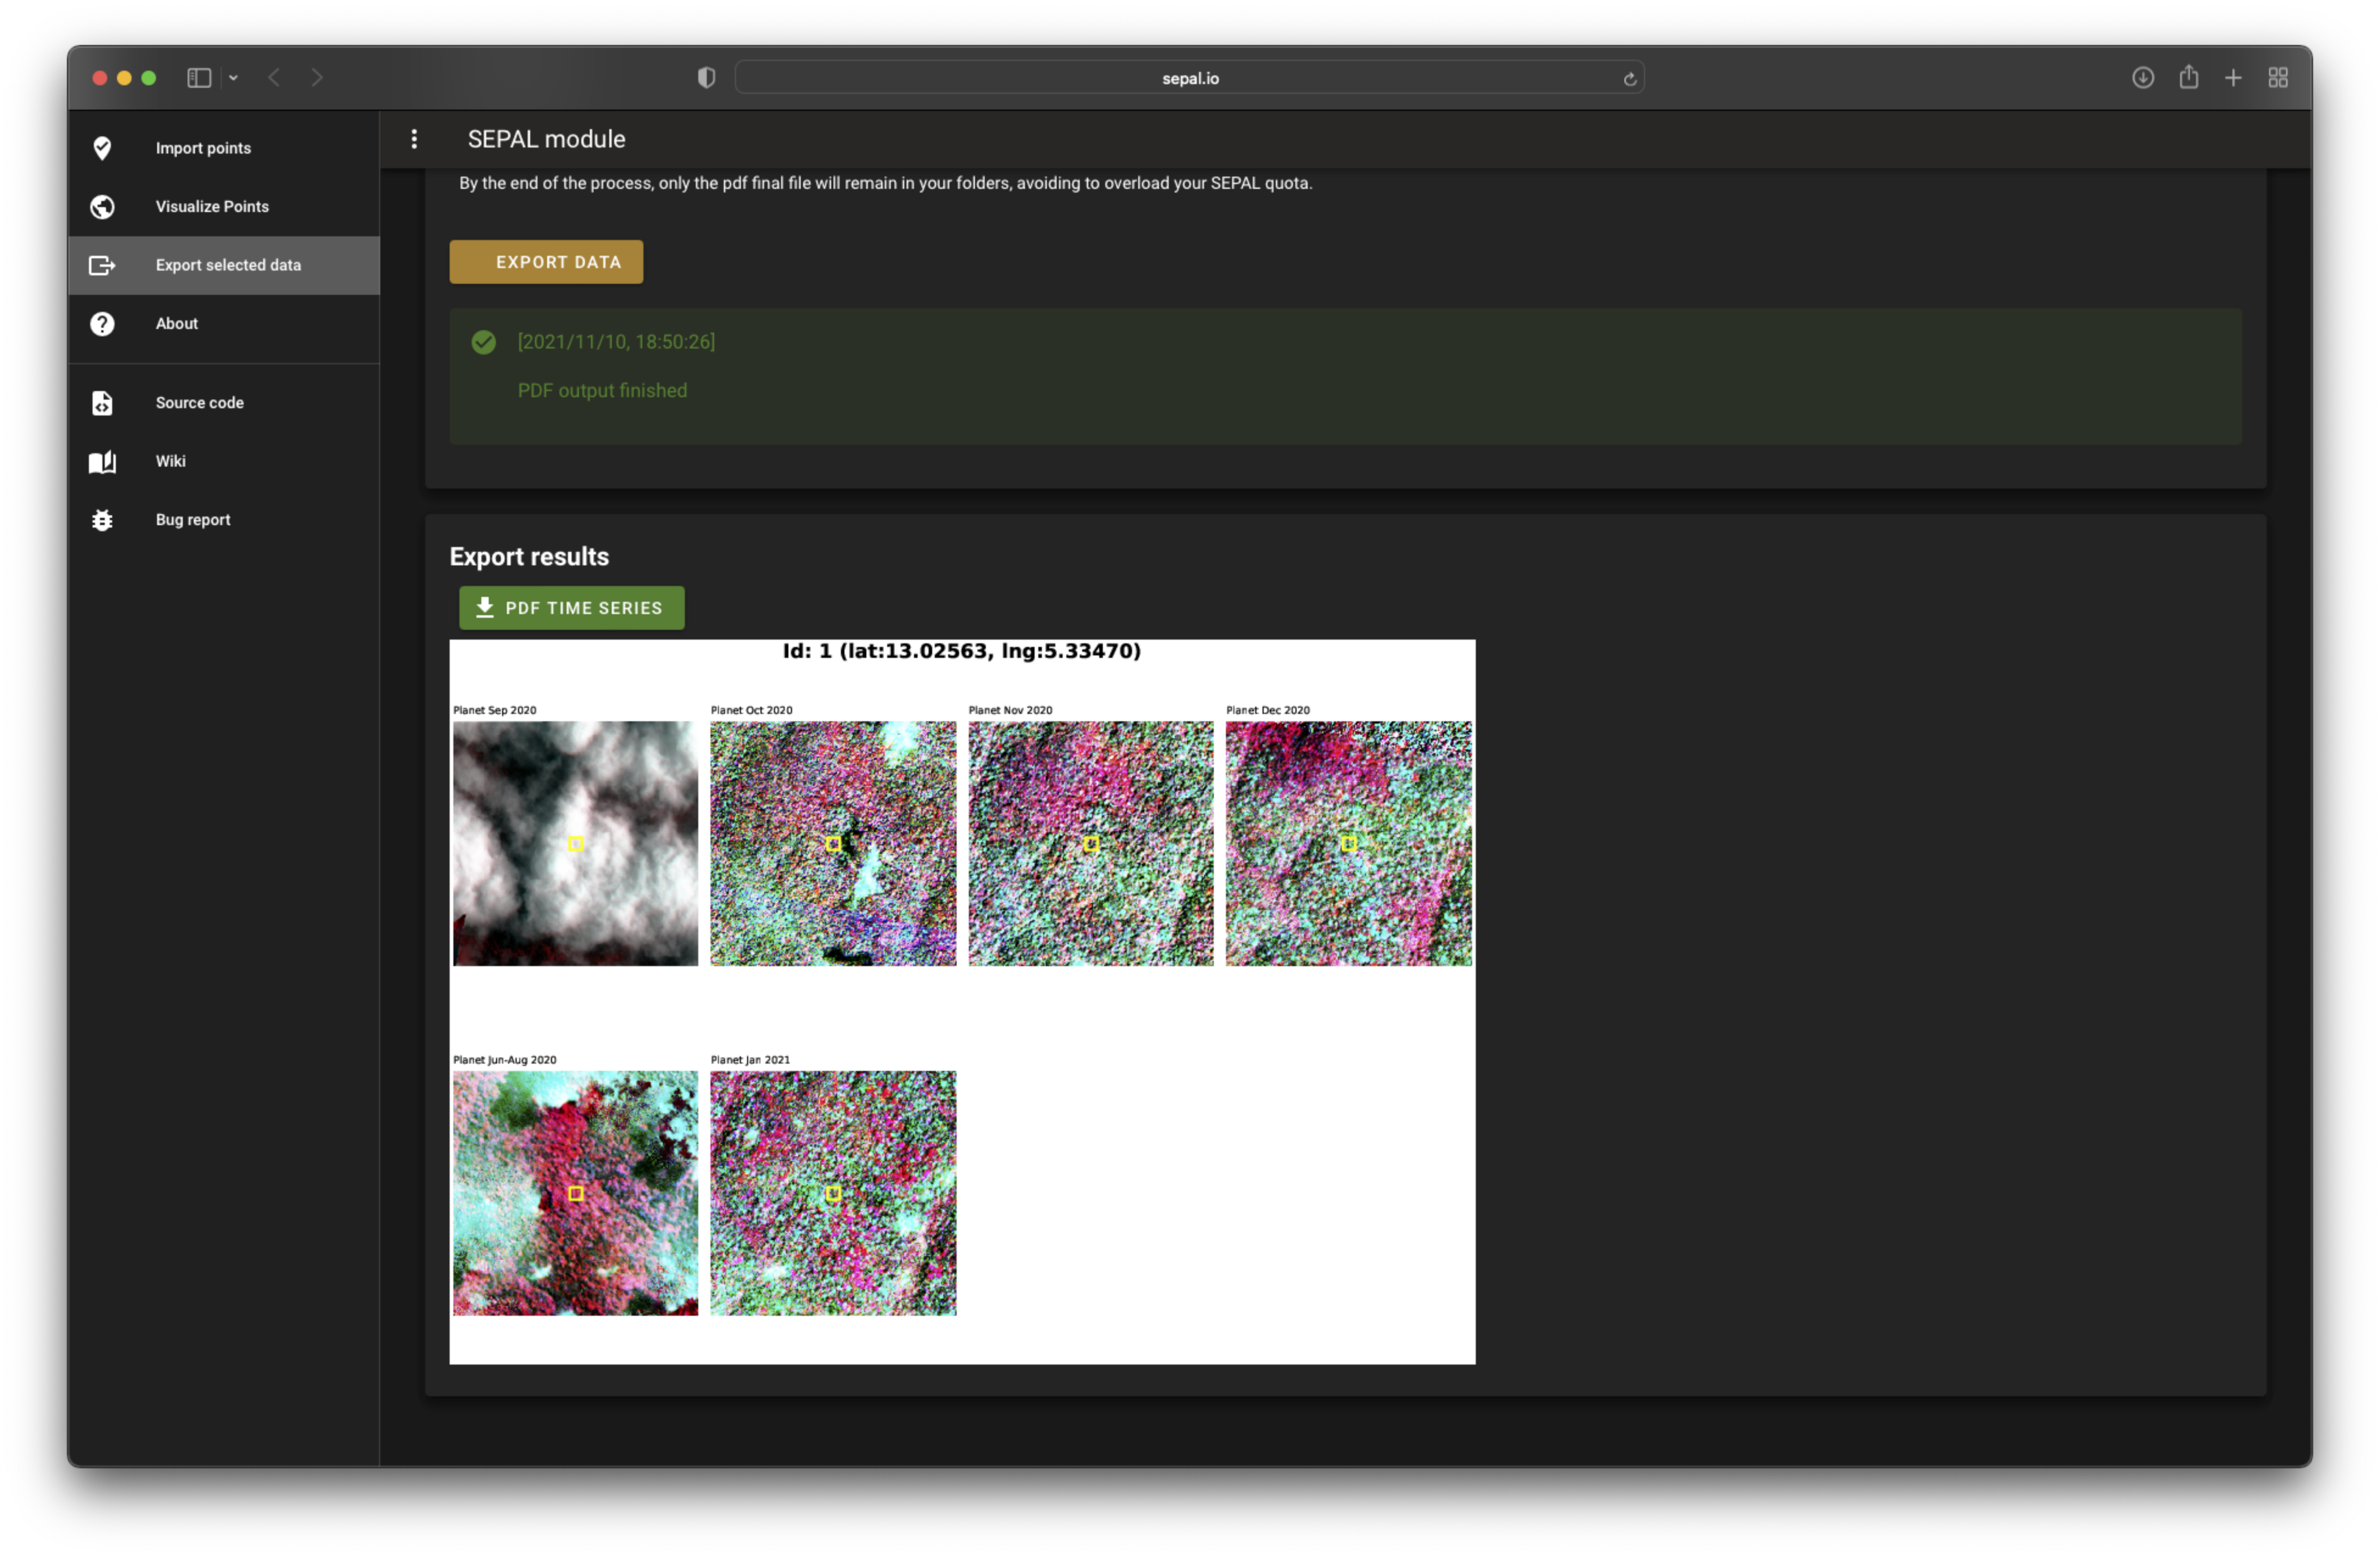
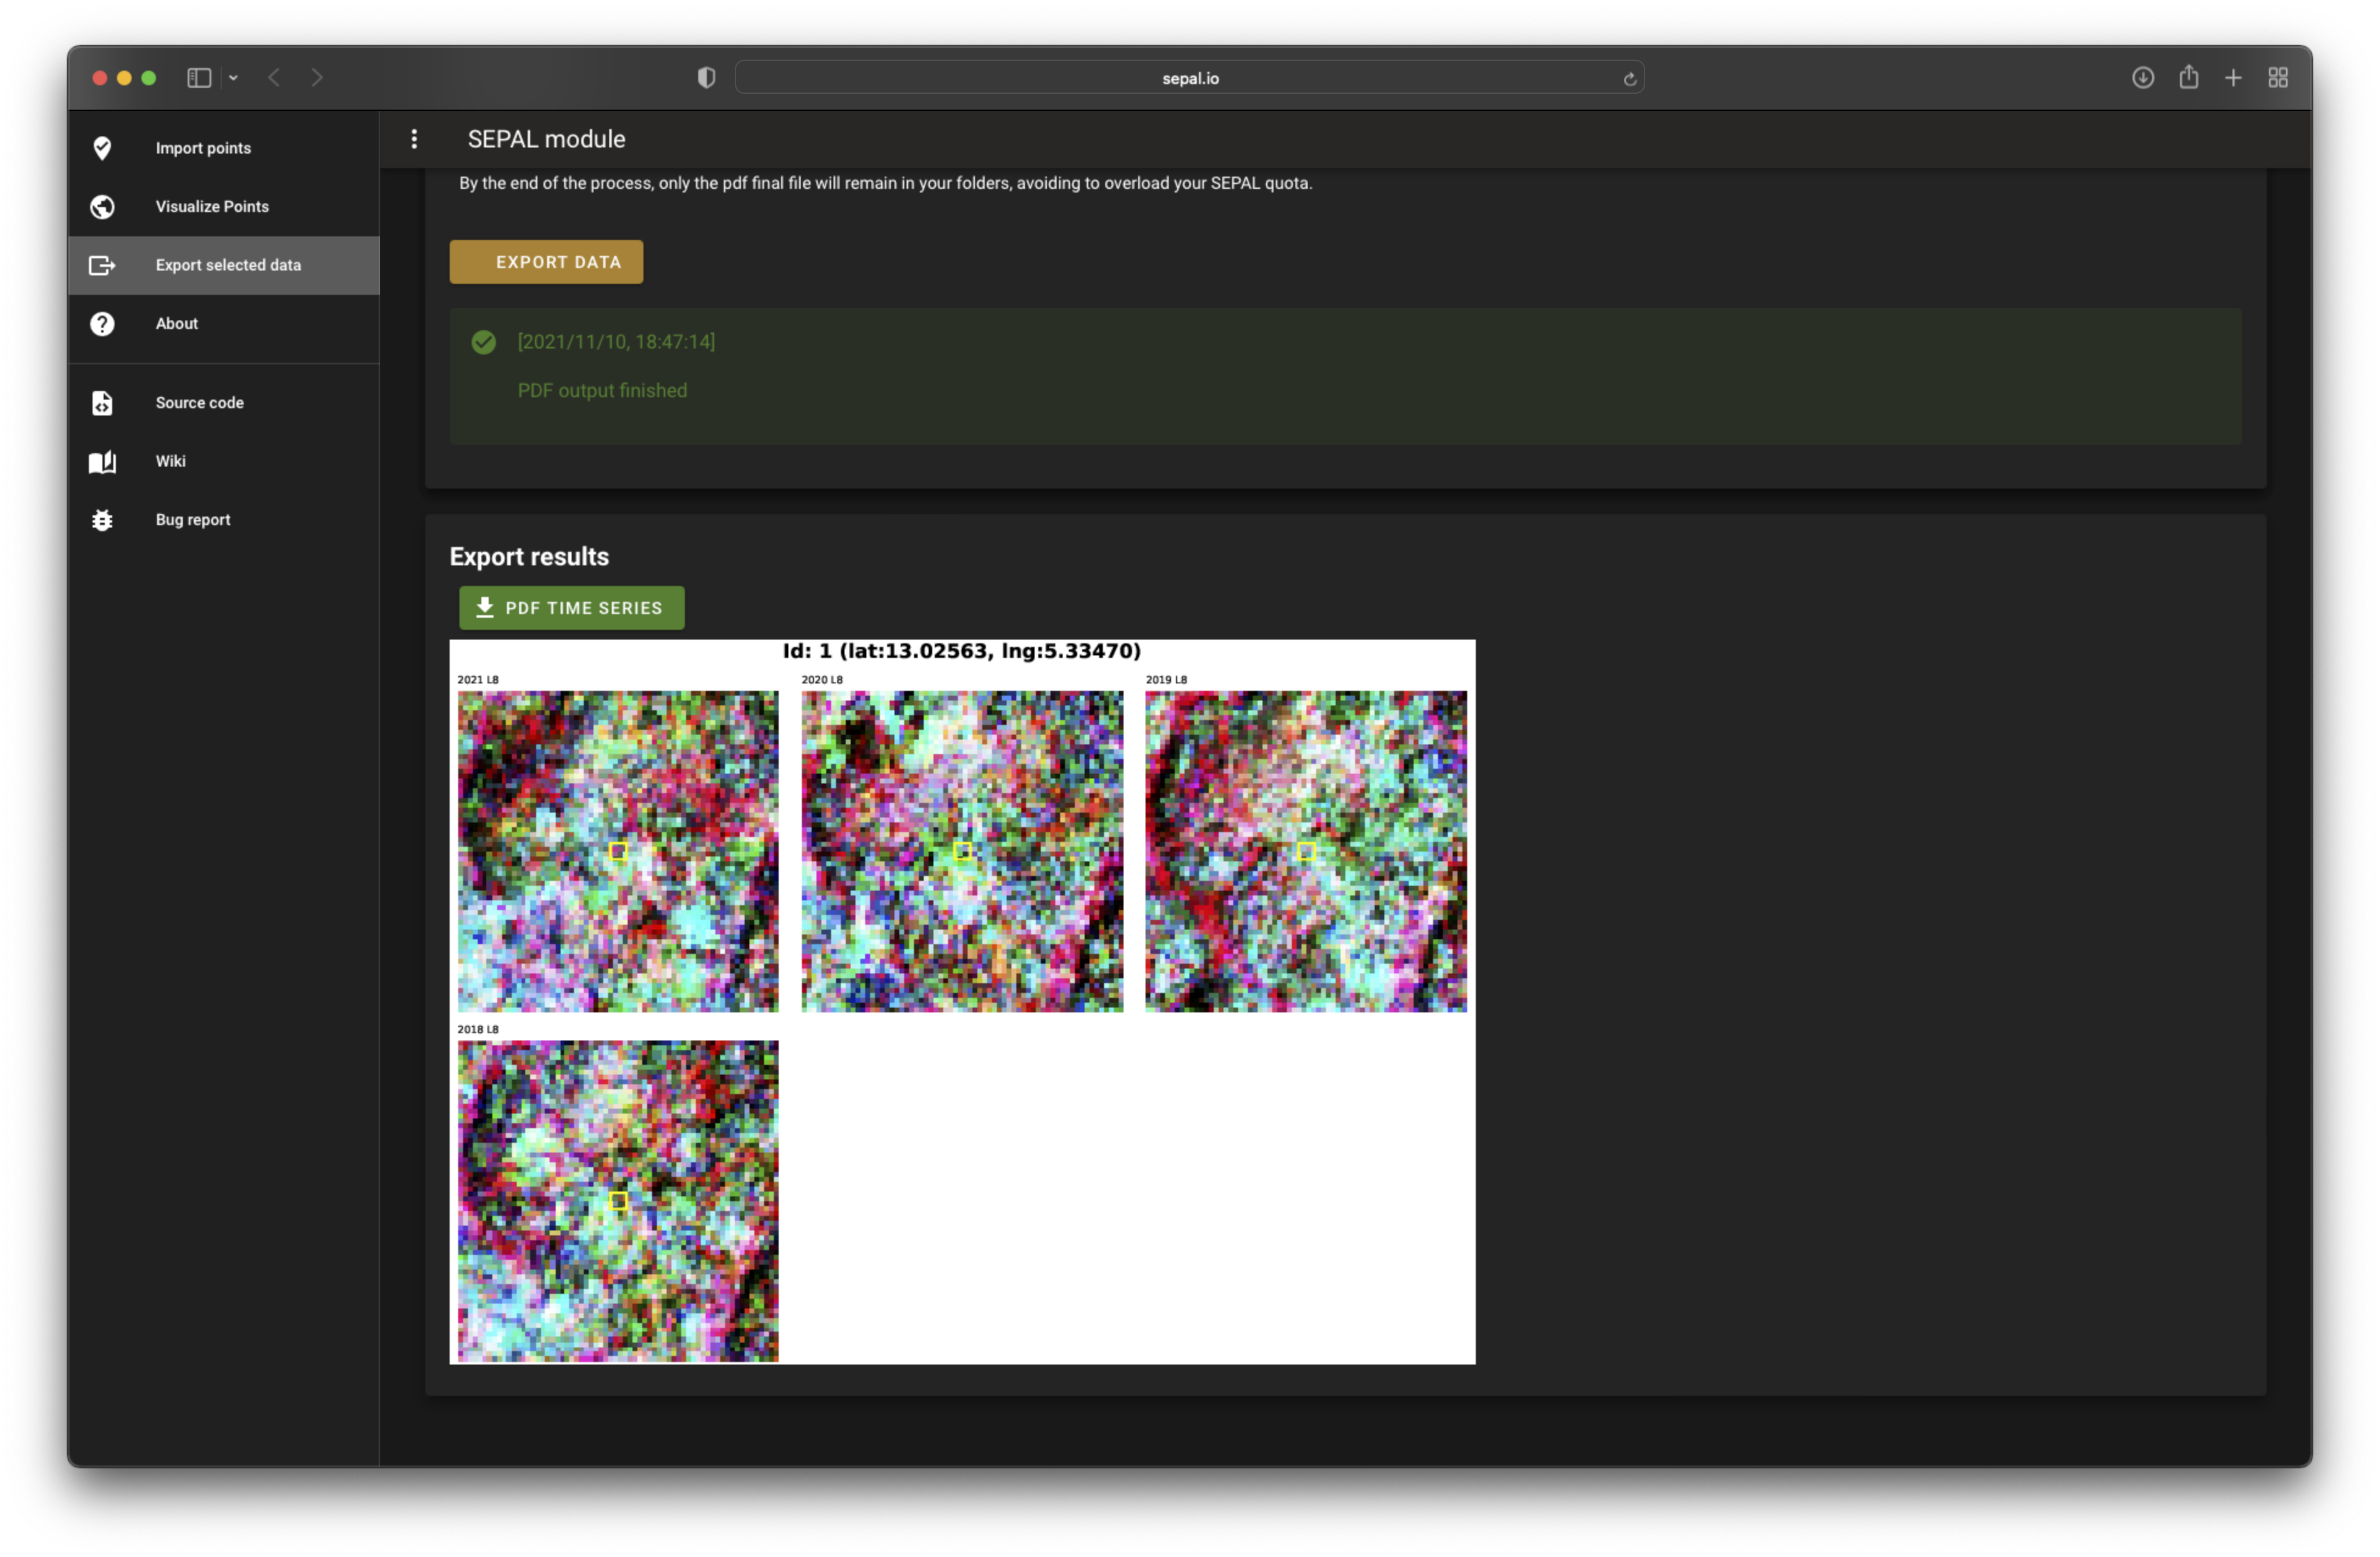
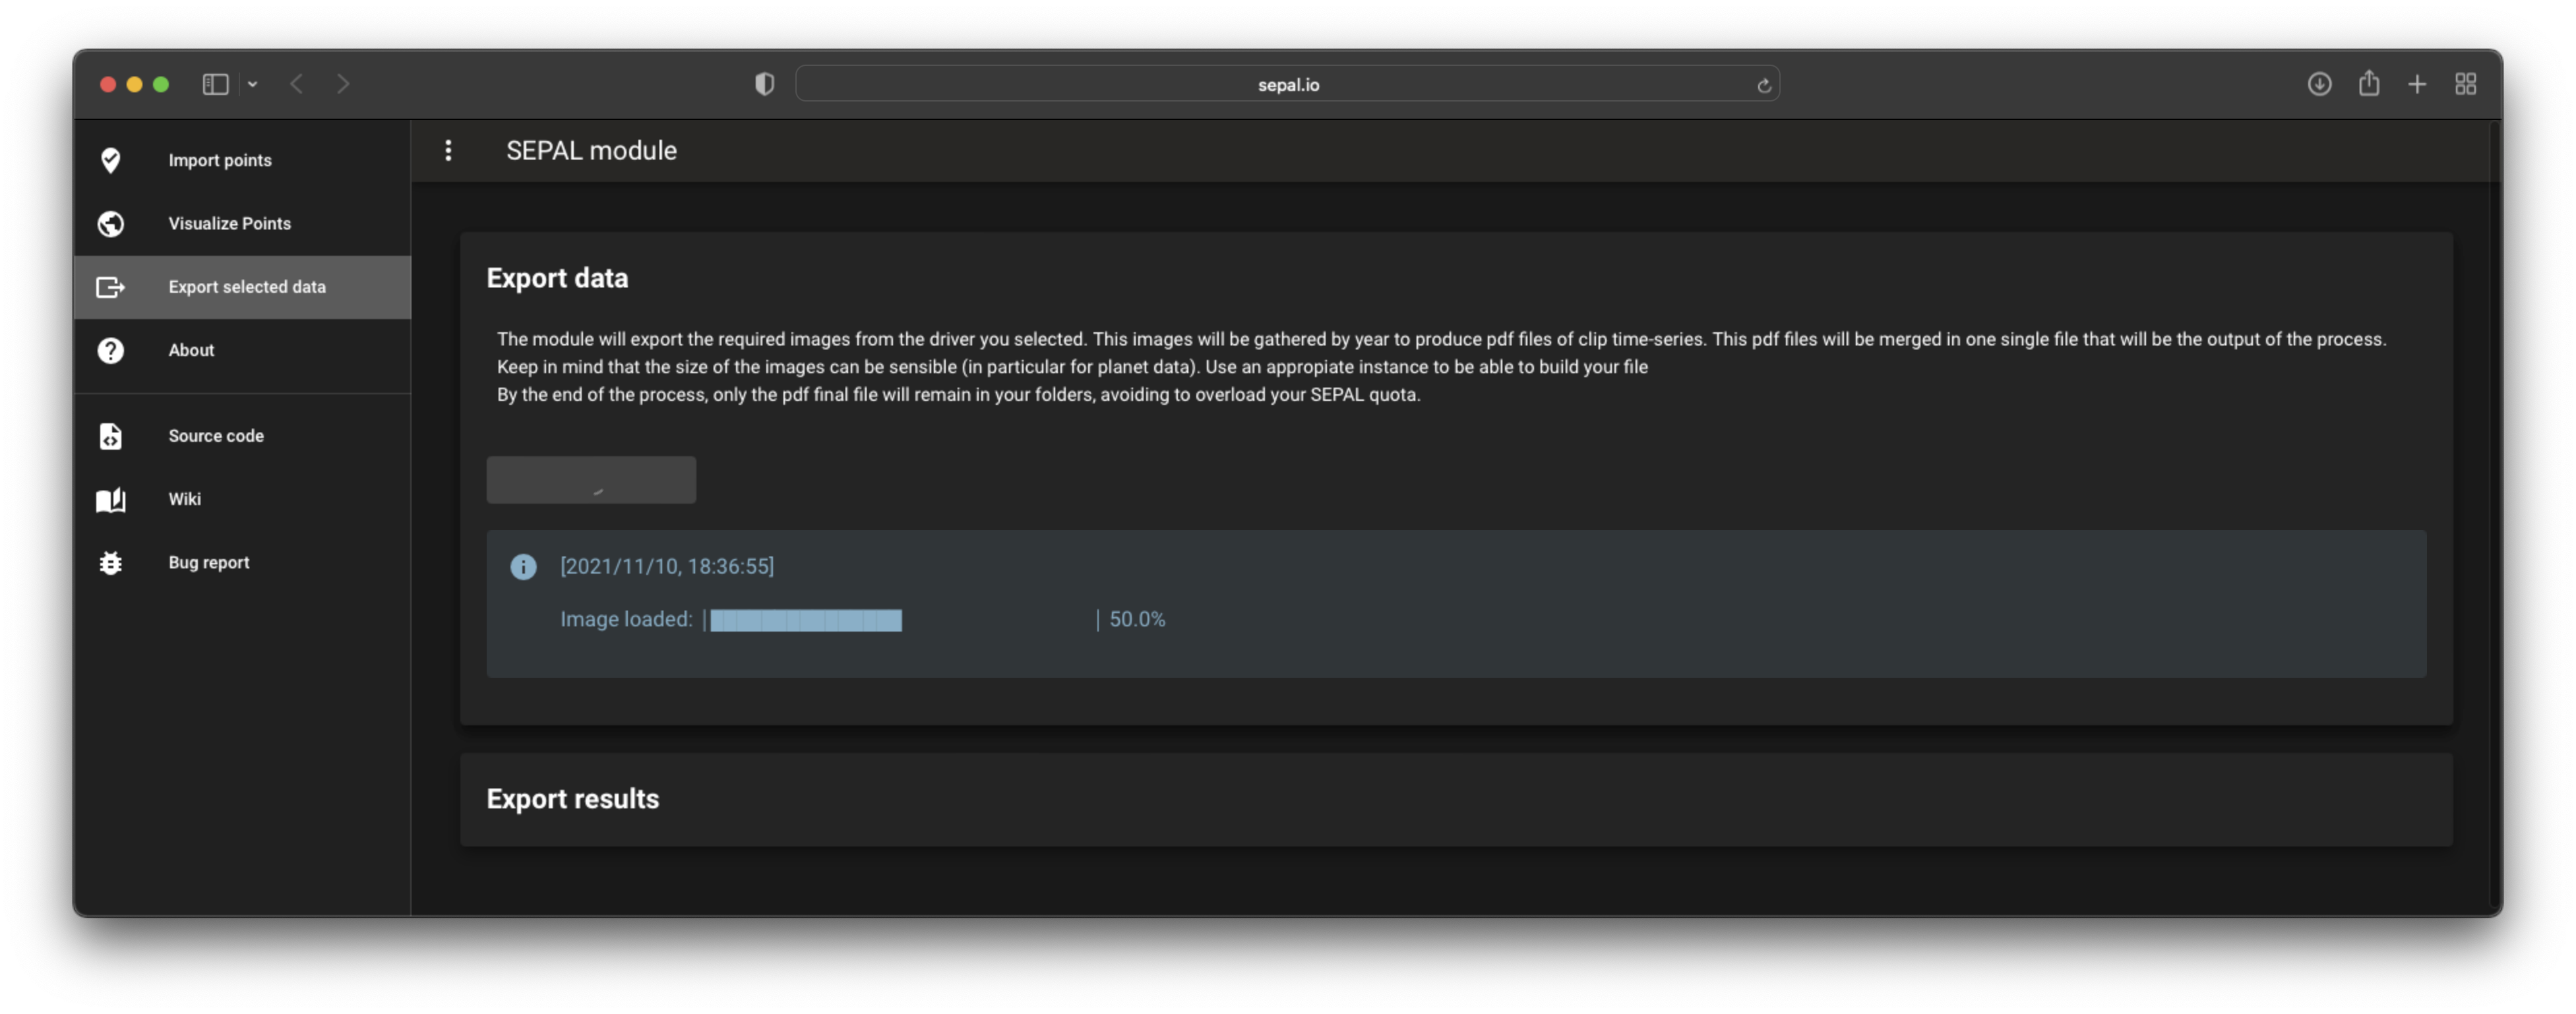
Export data#
Select the only available button to send your images to GEE or Planet.
Attention
The build of the .pdf file can consume lots of computation resources (e.g. RAM). If your module freezes more than two or three times, you’ve run out of memory and the Python kernel has died. Restart the process with a larger instance.
Note
To save space, the images will be removed from your Google Drive after the creation of the .pdf file.
Then, the module will present an active link in the green button to a preview of the first page of the pdf.