

SAE analysis#
Analyse results from a stratified sampling design for area estimates#
The aim of this stratified sampling design tool is to analyse results from a stratified sampling design that can be used for area estimates by combining a map (used as a stratification of the landscape of interest) with a visual map interpretation of samples to produce an area estimation.
The concept is derived from map accuracy assessment principles. Characterized frequency of errors (i.e. omission and commission) for each map class may be used to compute area estimates and estimate the uncertainties (i.e. confidence intervals) for the areas on each class.
First, open the tool by selecting Stratified Area Estimator (SAE) - Analysis in the Apps window.
You will land on the Introduction page which allows you to choose your language and provides background information on the tool. Note that Reference and documents are in the same place as the Design tool. The pages that contain the necessary steps for the workflow are on the left side of the screen and need to be completed sequentially.
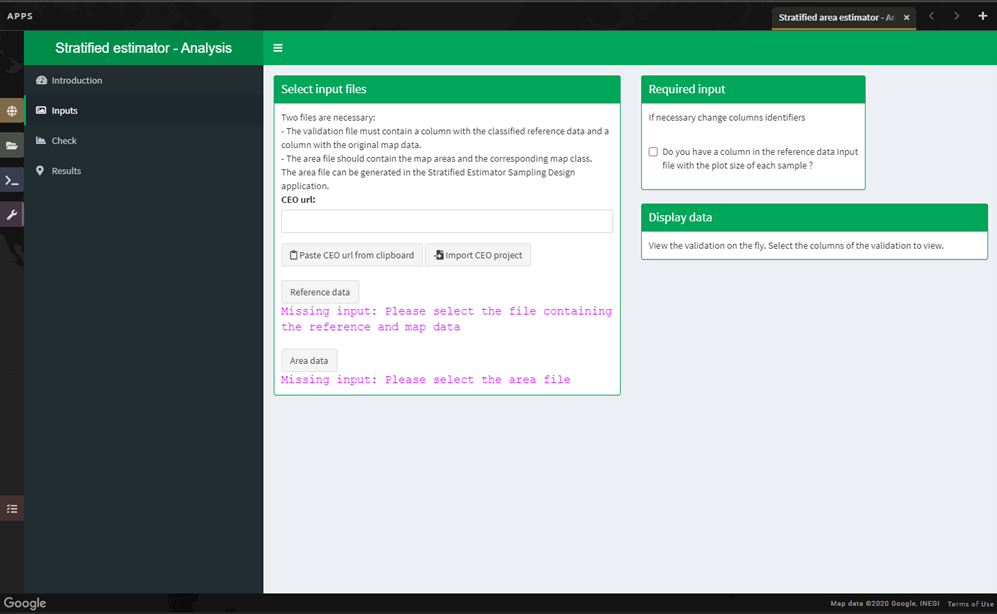
Select the Inputs page on the left side of the screen. You will see two data requirements under the Select input files section.
Reference data: This refers to the table that you classified and exported in the previous section. It will contain a column that identifies the map output class for each point, as well as a column for the value from the image interpreter (i.e. validation classification).
For projects completed in Collect Earth Online (CEO): Select the Reference data button and navigate to the .csv file you downloaded from CEO and uploaded to SEPAL.
For projects completed in the CEO-SEPAL bridge: - Check that you are logged out of the CEO website. - Paste the URL from your CEO-SEPAL bridge project into the field marked CEO URL, or simply select the Paste CEO URL from clipboard button. - Select
Import CEO project, which will populate the input file for the Reference data as well as the column names.
Area data: This is a .csv file that was automatically created during the SAE – Design workflow. It contains area values for each mapped land cover class.
Select the Area data button.
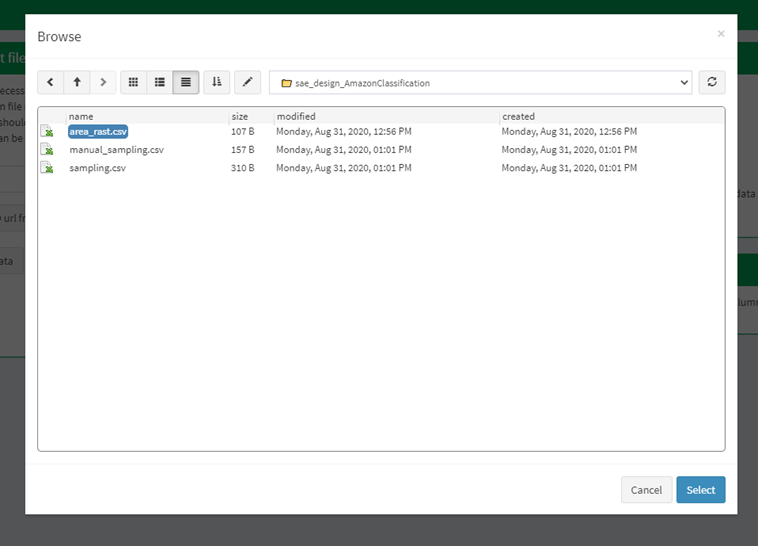
Open the folder starting with
sae_design_. As a reminder, if you exported your classification to the SEPAL workspace, the file will be in your SEPAL Downloads folder. Within this folder, select area_rast.csv (see image below).
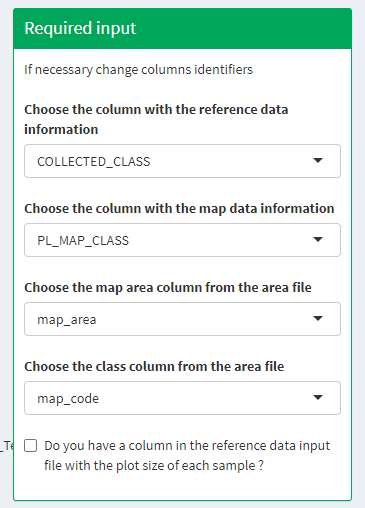
Next, you will need to adjust some parameters so that the tool recognizes the column names for your reference data and area data that contain the necessary information for your accuracy assessment. You should now see a populated Required input pane on the right side of the screen.
Choose the column with the reference data information.
Note
For projects completed in CEO: This will either be your question name or the new column name you created in Part 2 above. Here, it is COLLECTED_CLASS, following the directions.
For projects completed in CEO-SEPAL: ref_code
Choose the column with the map data information.
Note
For projects completed in CEO: PL_MAP_CLASS
For projects completed in CEO-SEPAL: map_code
Select the map area column from the area file—map_area.
Choose the class column from the area file—map_code or map_edited_class (the map_code has the numeric class codes, while the map_edited_class has the names you entered manually during the design phase).
Note
For projects completed in CEO: Use map_code if you have a column in your reference data. If you use map_edited_class you must make sure that capitalization is correct.
For projects completed in CEO-SEPAL: Use map_code.
You can add a Display data column to enable validation on the fly. You can choose any column from your CEO or CEO-SEPAL project. We recommend either your map class (e.g. PL_MAP_CLASS) or your reference data class (e.g. question name column). This example uses a CEO project.
Once you have set these input parameters, select Check on the left side of the window. This page will plot your samples on a world map. Fix the location of your plots by specifying the correct columns to use as the X and Y coordinates in the map. Select the dropdown menus and choose the appropriate coordinate columns for X and Y coordinates (the X coordinate should be LON; the Y coordinate should be LAT).
Next, select the Results page on the left side of the screen.
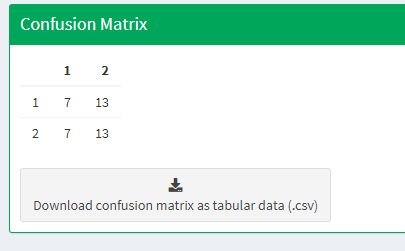
The Results page will display a few different accuracy statistics, including a Confusion matrix, Area estimates, and a Graph of area estimates with confidence intervals. The Confusion matrix enables you to assess the agreement of the map and validation data sets.
The rows represent your assignments while the columns represent the map classifiers. The diagonal represents the number of samples that are in agreement, while the off-diagonal cells represent points that were not mapped correctly (or potentially not interpreted correctly).
Typically you would have to create the confusion table yourself and calculate the accuracies; however, the SAE analysis tool does this for you.
See also
If you completed previous sections, how does the SAE analysis tool’s calculations compare with your own?
You can download confusion matrices as tabular data (.csv) using the button.
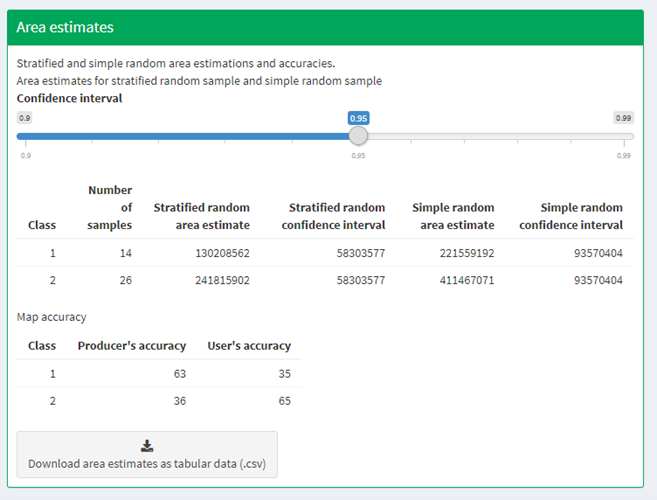
Under Area estimates, the table shows you the area estimates, as well as producers’ and users’ accuracies, all of which were calculated from the error matrix and the class areas (sample weights) from the map product you are assessing.
Estimations are broken up into simple and stratified estimates, each of which has its own confidence interval. In this exercise, we collected validation data using a stratified sample, so the values we need to use are the stratified random values. Note that all area estimates are in map units. You can change your desired Confidence interval using the slider at the top of the panel. You can download area estimates as tabular data (.csv) using the button.
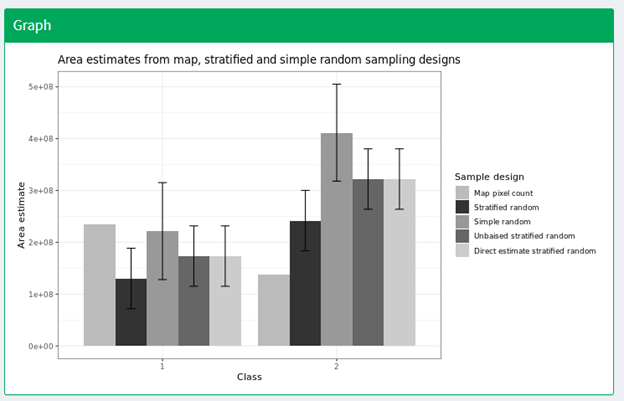
The Graph plots area estimates based on map pixel count, stratified random sample, simple random sample, unbiased stratified random and direct estimate stratified random.
In this exercise, we collected validation data using a stratified sample, so the values we need to use are the stratified random values. We also need to define unbiased stratified random and direct estimate stratified random.
Note
Note that the Map pixel count value differs from these stratified random sample estimates. This shows how using a map pixel count is a poor estimation of actual area.
For support, ask the community.