Resilient rivers and basins#
Understand forest cover and forest cover change from a watershed perspective
Overview#
The Resilient rivers and basins beta app is a tool that describes forest cover and forest cover change from a watershed perspective by calculating statistics across subwatersheds over time; watersheds of interest will be defined by the upstream basin draining to any given point. These processes can be conducted directly in your SEPAL instance without requiring additional resources.
To run this module, we recommend initializing a machine with at least 4 GB RAM (a t2 or m2 instance). For more detailed instructions, see Start instance manually.
Inputs#
Once you have started an instance, search in the Apps tab for the Resilient rivers and basins app, which is composed of two main sections:
Left pane, which displays all processes (i.e. inputs and results) at the top, and some helpful links (e.g. bug report, wiki, source code) at the bottom; and
Right pane, which displays process and inputs.
By default, the Input drawer will be active. It is divided into two main panes:
Left pane, which displays all of the input parameters to derive statistics.
Right pane, which displays the map view where calculated layers will be loaded.
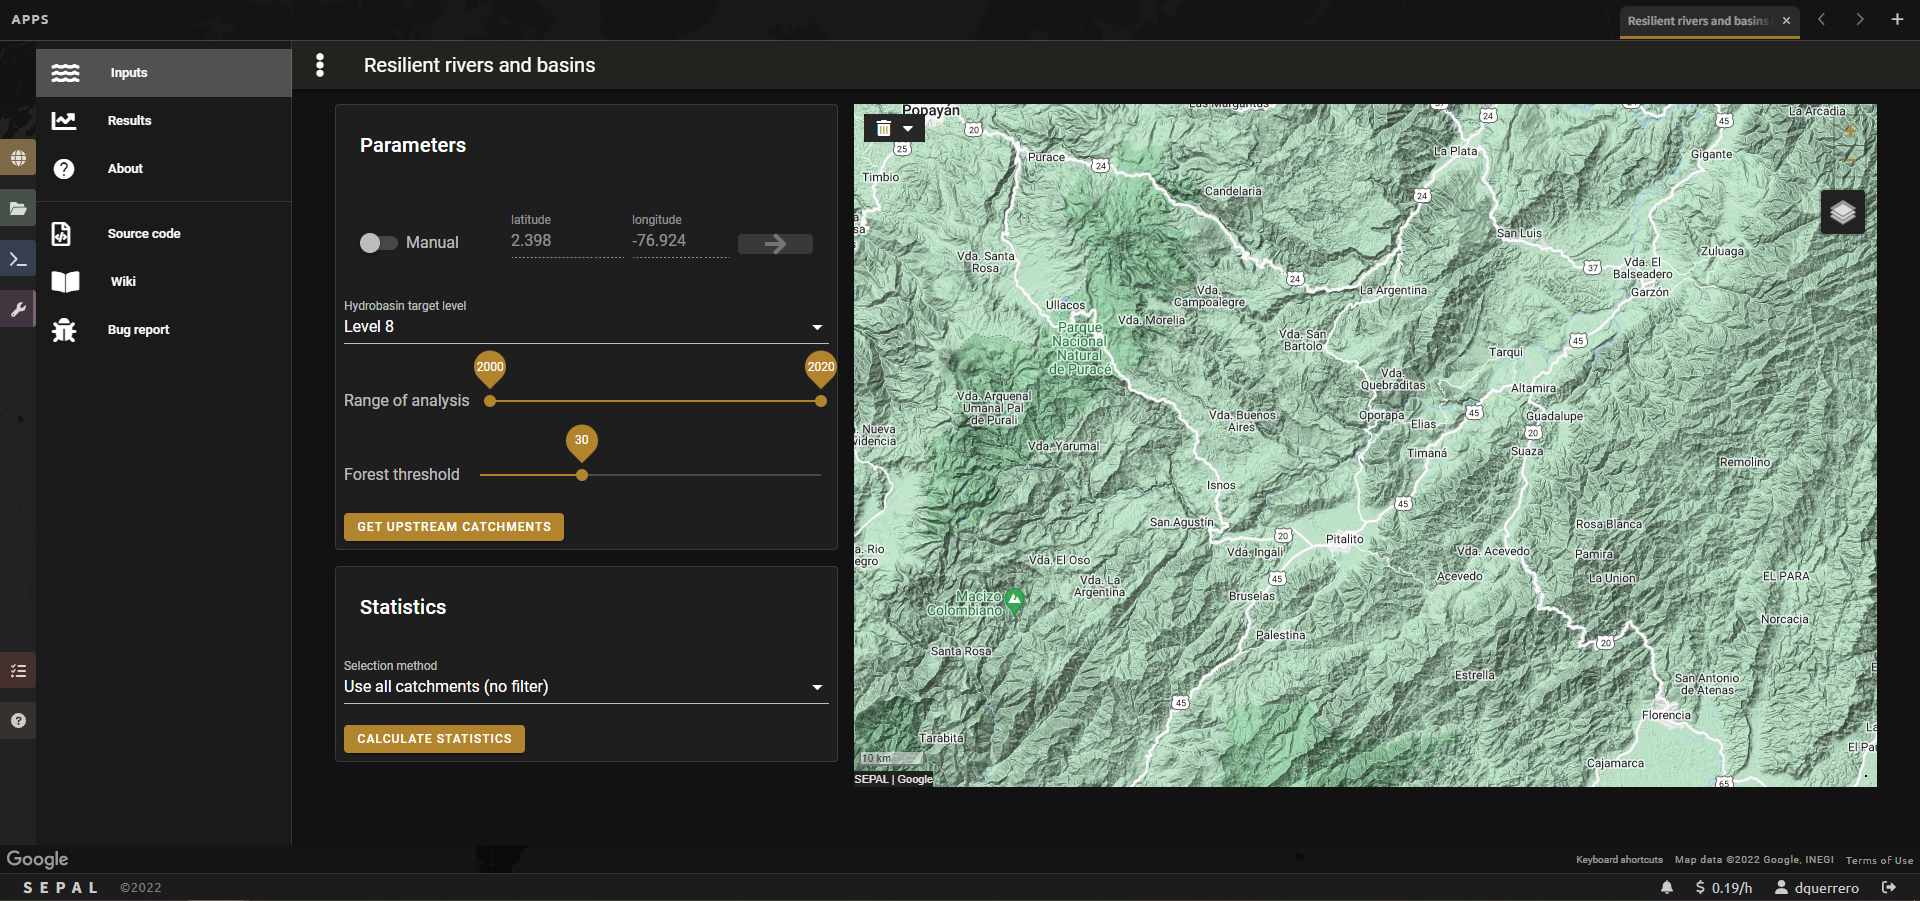
The first input needed is a Coordinate pair, which will be used to calculate and retrieve all of the upstream sub-basins that drain to that point for any given HydroBASIN level.
To input coordinates, the module has two options: Manual and Automatic.
To use Manual selection, enter the latitude and longitude coordinates, then select Next. The map will set a blue marker at that point and zoom into the area of interest (AOI).
To use Automatic selection, turn off the Manual switch and navigate through the map to find your desired area. Select the exact spot (usually a river confluence or a bridge, but terrestrial areas work as well); a blue marker will be displayed.
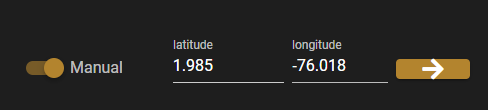
Note
When using the Automatic selection method, the latitude and longitude input text fields will be deactivated. Notice that the coordinates will be automatically synchronized as you move the cursor over the map.
The next step is to select the HydroBASIN target level by using the dropdown list.
HydroBASINs are delineated basins in the HydroATLAS database. Their levels range from 5 to 12, where higher numbers indicate smaller basins nested inside larger sub-basins.
For more information about how these data are obtained, see the HydroSHEDS documentation.
The forest cover change map is based on the Global Forest Change product (Hansen et al., 2013), retrieved from Google Earth Engine (GEE). Created to show forest cover change on a global-scale based on Landsat imagery, the product has forest change data from 2000 to 2001.
The Resilient rivers and basins app will crop and summarize forest cover statistics for each of the forest cover classes at the selected basin scale (i.e. the HydroBASIN level).
To begin, use the sliders to select the Start and end year.
Next, select the Forest threshold, which determines the level of tree cover required for a pixel in the Global Forest Change (GFC) product to be classified as Forest. Changing the value will alter the amount of forest cover or forest cover change observed.
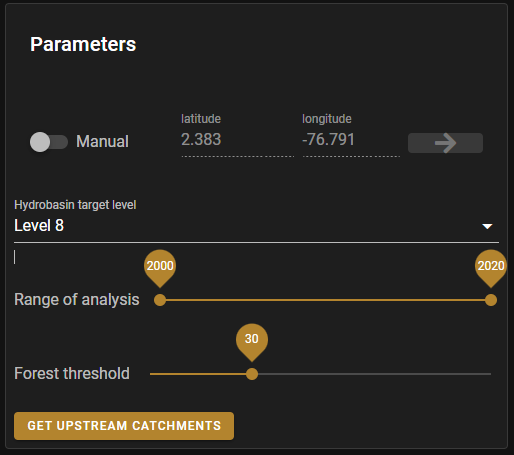
Select the Get upstream basins button to run the process. The results will be displayed as a map of forest cover change by sub-basin.
Note
The amount of time required for calculation depends on the selected HydroBASIN level and the Location of the downstream point.
Also, the number of Sub-basins displayed will vary depending on the Downstream point (e.g. a watershed draining to a point at the mouth of a fairly mountainous area will include more upstream sub-basins than a watershed draining to a higher-level point in the same orography).
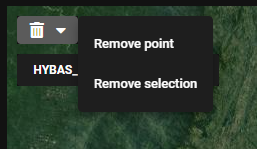
To start a new process, you can use the Trash bin button in the upper left of the map to remove the Downstream point or remove the Sub-basins selection (for more information, see the next subsection, which explains how to constrain the analysis to a given set of sub-basins).
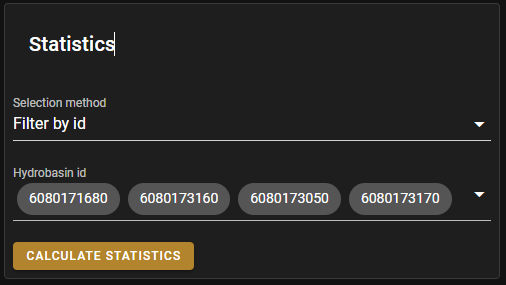
To calculate and display statistical results in the Results dashboard, use the Statistics tile. There are two selection methods:
No filter (i.e. use all basins)
Filter
When using the Filter option, a new dropdown menu will appear at the bottom of the tile with all of the sub-basin IDs.
Manually select or remove Sub-basins by selecting each row. Notice that the map will automatically sync the selected basins by displaying a black boundary and zooming in.
Select the Calculate statistics button.
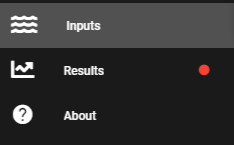
Once the dashboard is calculated, a red dot will be displayed in the Results drawer, as seen in the image below:
Dashboard#
The Dashboard pane is divided into three main sections:
the Settings tile in the upper left;
the Pie chart in the upper right; and
Detailed charts at the bottom.
Tip
All graphs have an option for independent download directly to your browser. Simply hover the cursor in the upper-right corner and select the icon.
In the Settings tile, you can choose the variable to display:
All
Gain and loss
Loss
Non-forest
Forest
Gain
By choosing one of these options, all graphs will display the selected statistics. From this menu, you can also filter the data by one or more sub-basins, allowing the possibility of generating dynamic comparisons between areas.
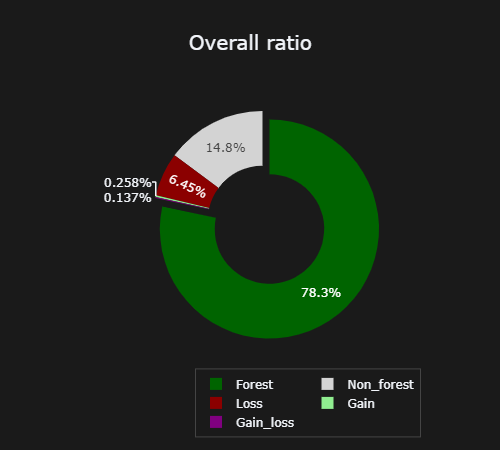
The Overall ratio is an interactive pie chart that displays the output variable of each subcategory by proportion. It also allows you to directly select one subcategory to be used in the detailed charts. Simply select any subcategory and the corresponding slice will be showcased.
The detailed, interactive charts at the bottom display both the Ratio and the Total area of the selected variable.
On the left, the Pie chart shows the proportion of the area for each of the selected sub-basins.
On the right, the Bar chart displays the absolute values.
Note
In the GFC product dataset (Hansen et al., 2013), only forest loss has a temporal dimension. When a new time period is selected, a new graph representing the trend of forest loss will be displayed at the bottom of the screen.