

Forest Canopy Disturbance Monitoring (FCDM)#
Map canopy disturbances (natural- or human-induced) within (semi-)evergreen forests
Note
Formerly Delta-rNBR (Version 2.4)
FCDM tool#
Overview#
The Forest Canopy Disturbance Monitoring (FCDM) tool supports the detection of forest canopy disturbance from remote sensing satellites, providing indications of forest degradation processes.
Reporting on forest degradation is required by many tropical countries participating in the REDD+ programme (REDD+ refers to Reducing Emissions from Deforestation and Forest Degradation and the role of conservation, sustainable management of forests and enhancement of forest carbon stocks in developing countries). However, compared to deforestation, the mapping of forest degradation has proven to be much more challenging technically. In particular, signs of a forest canopy disturbance is less prominent, as it does not result in a change of land cover.
The FCDM tool has been developed at the Joint Research Centre (JRC) within the ReCaREDD Project. It uses a change detection approach based on the difference (delta) of the self-referenced “Normalized Burn Ratio” index (Delta-rNBR) (Langner et al. [2018]), in order to detect forest canopy change over defined periods at the pixel and sub-pixel level. The underlying Delta-rNBR index allows the detection of forest canopy disturbance within tropical (semi-)evergreen forest canopies (“forest remaining forest”), resulting from certain actions (e.g. tree removal, felling damages, logging trails, and leading).

General purpose#
detection of all kinds of tree canopy disturbances (natural or human-induced) within evergreen and semi-evergreen forests;
manual screening of data by an experienced human interpreter in order to separate natural disturbances from human disturbances; and
near real-time (NRT) monitoring of possible canopy cover changes.
Citation#
Publications, models and data products that make use of this tool must include proper acknowledgement, including citing datasets and presenting the following reference for the source:
Langner, A., Miettinen, J., Kukkonen, M., Vancutsem, C., Simonetti, D., Vieilledent, G., Verhegghen, A., Gallego, J. & Stibig, H-J. 2018. Towards Operational Monitoring of Forest Canopy Disturbance in Evergreen Rain Forests: A Test Case in Continental Southeast Asia. Remote Sensing, 10(4): 544. https://doi.org/10.3390/rs10040544
Contact#
> Original algorithm > Author: Andreas Langner (SvBuF) > Email: andi.langner@gmail.com, andreas-johannes.langner@ec.europa.eu
> SEPAL adaptation > Author: Pierrick Rambaud (FAO) > Email: Pierrick.rambaud@fao.org
Usage#
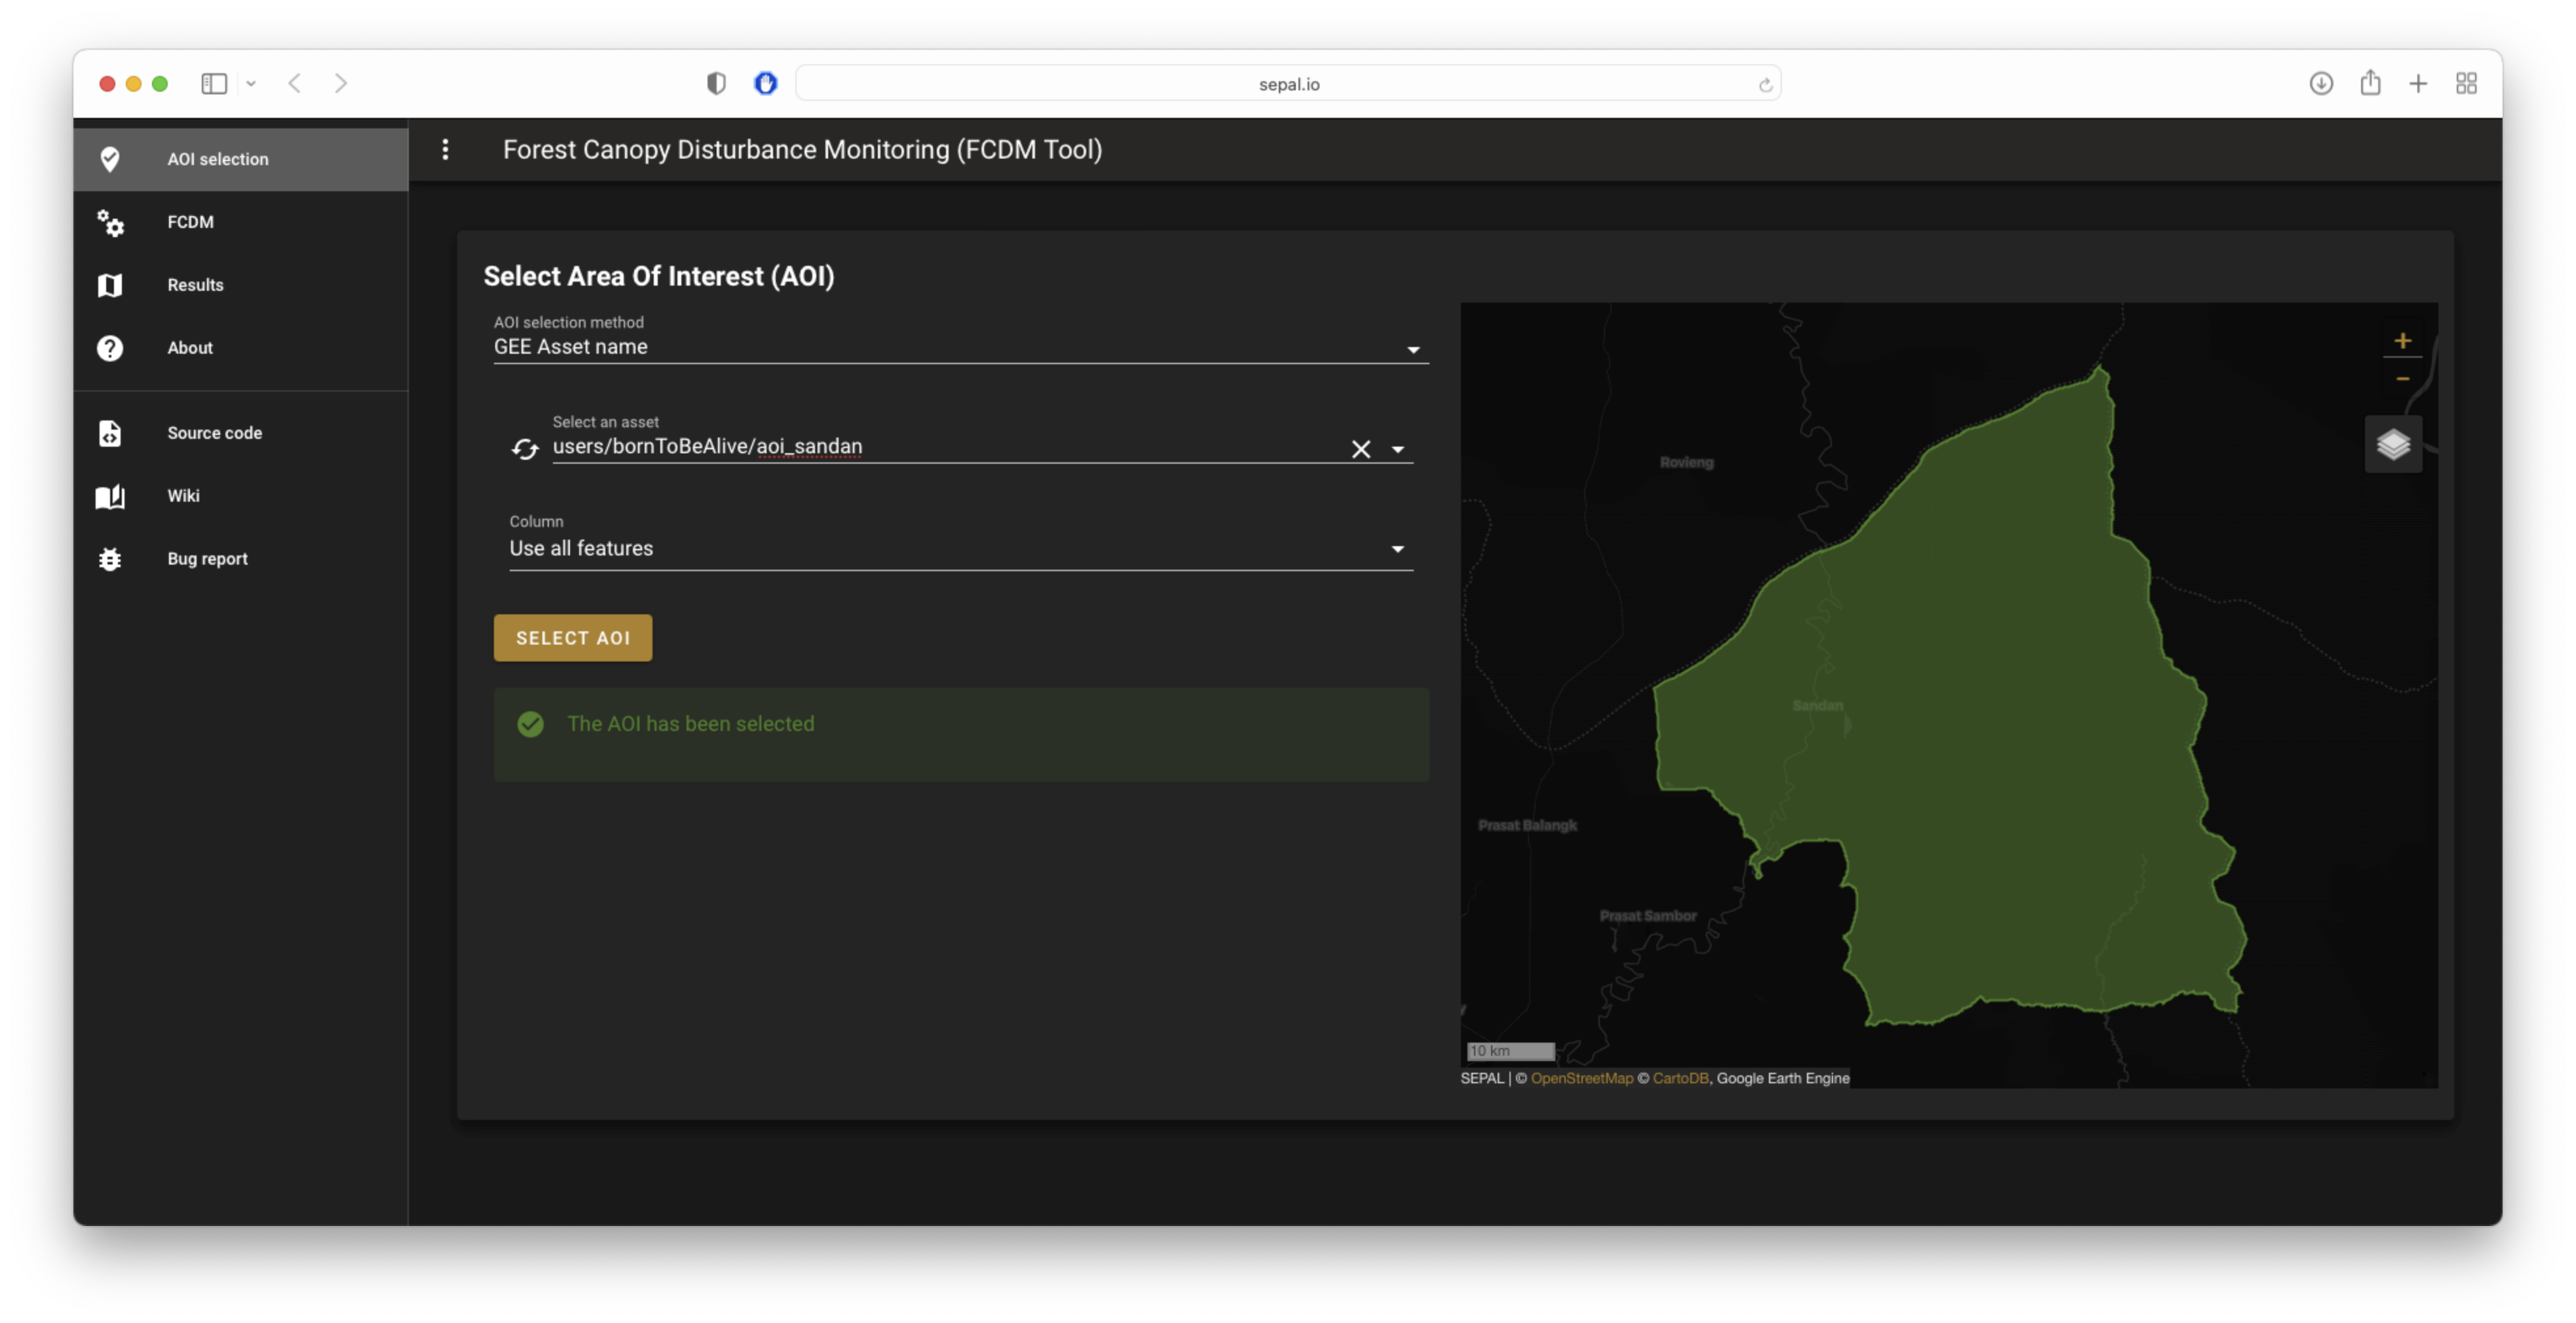
Select an area of interest#
Delta-rNBR will be calculated based on user inputs. The first mandatory input is the area of interest (AOI). In this step, you’ll have the possibility to choose from a pre-defined list of administrative layers or use your own datasets. The available options are:
Pre-defined layers
Country/province
Administrative Level 1
Administrative Level 2
Custom layers
Vector file
Drawn shapes on map
Google Earth Engine (GEE) asset
After choosing the desired area, select the Select these inputs button; the map will show your selection.
Note
You can only select one AOI. In some cases, depending on the input data, you could run out of resources in GEE.
Workflow parameters#
Select process to display the Process pane. In this subsection, we will describe the parameters available in the app to customize your analysis.
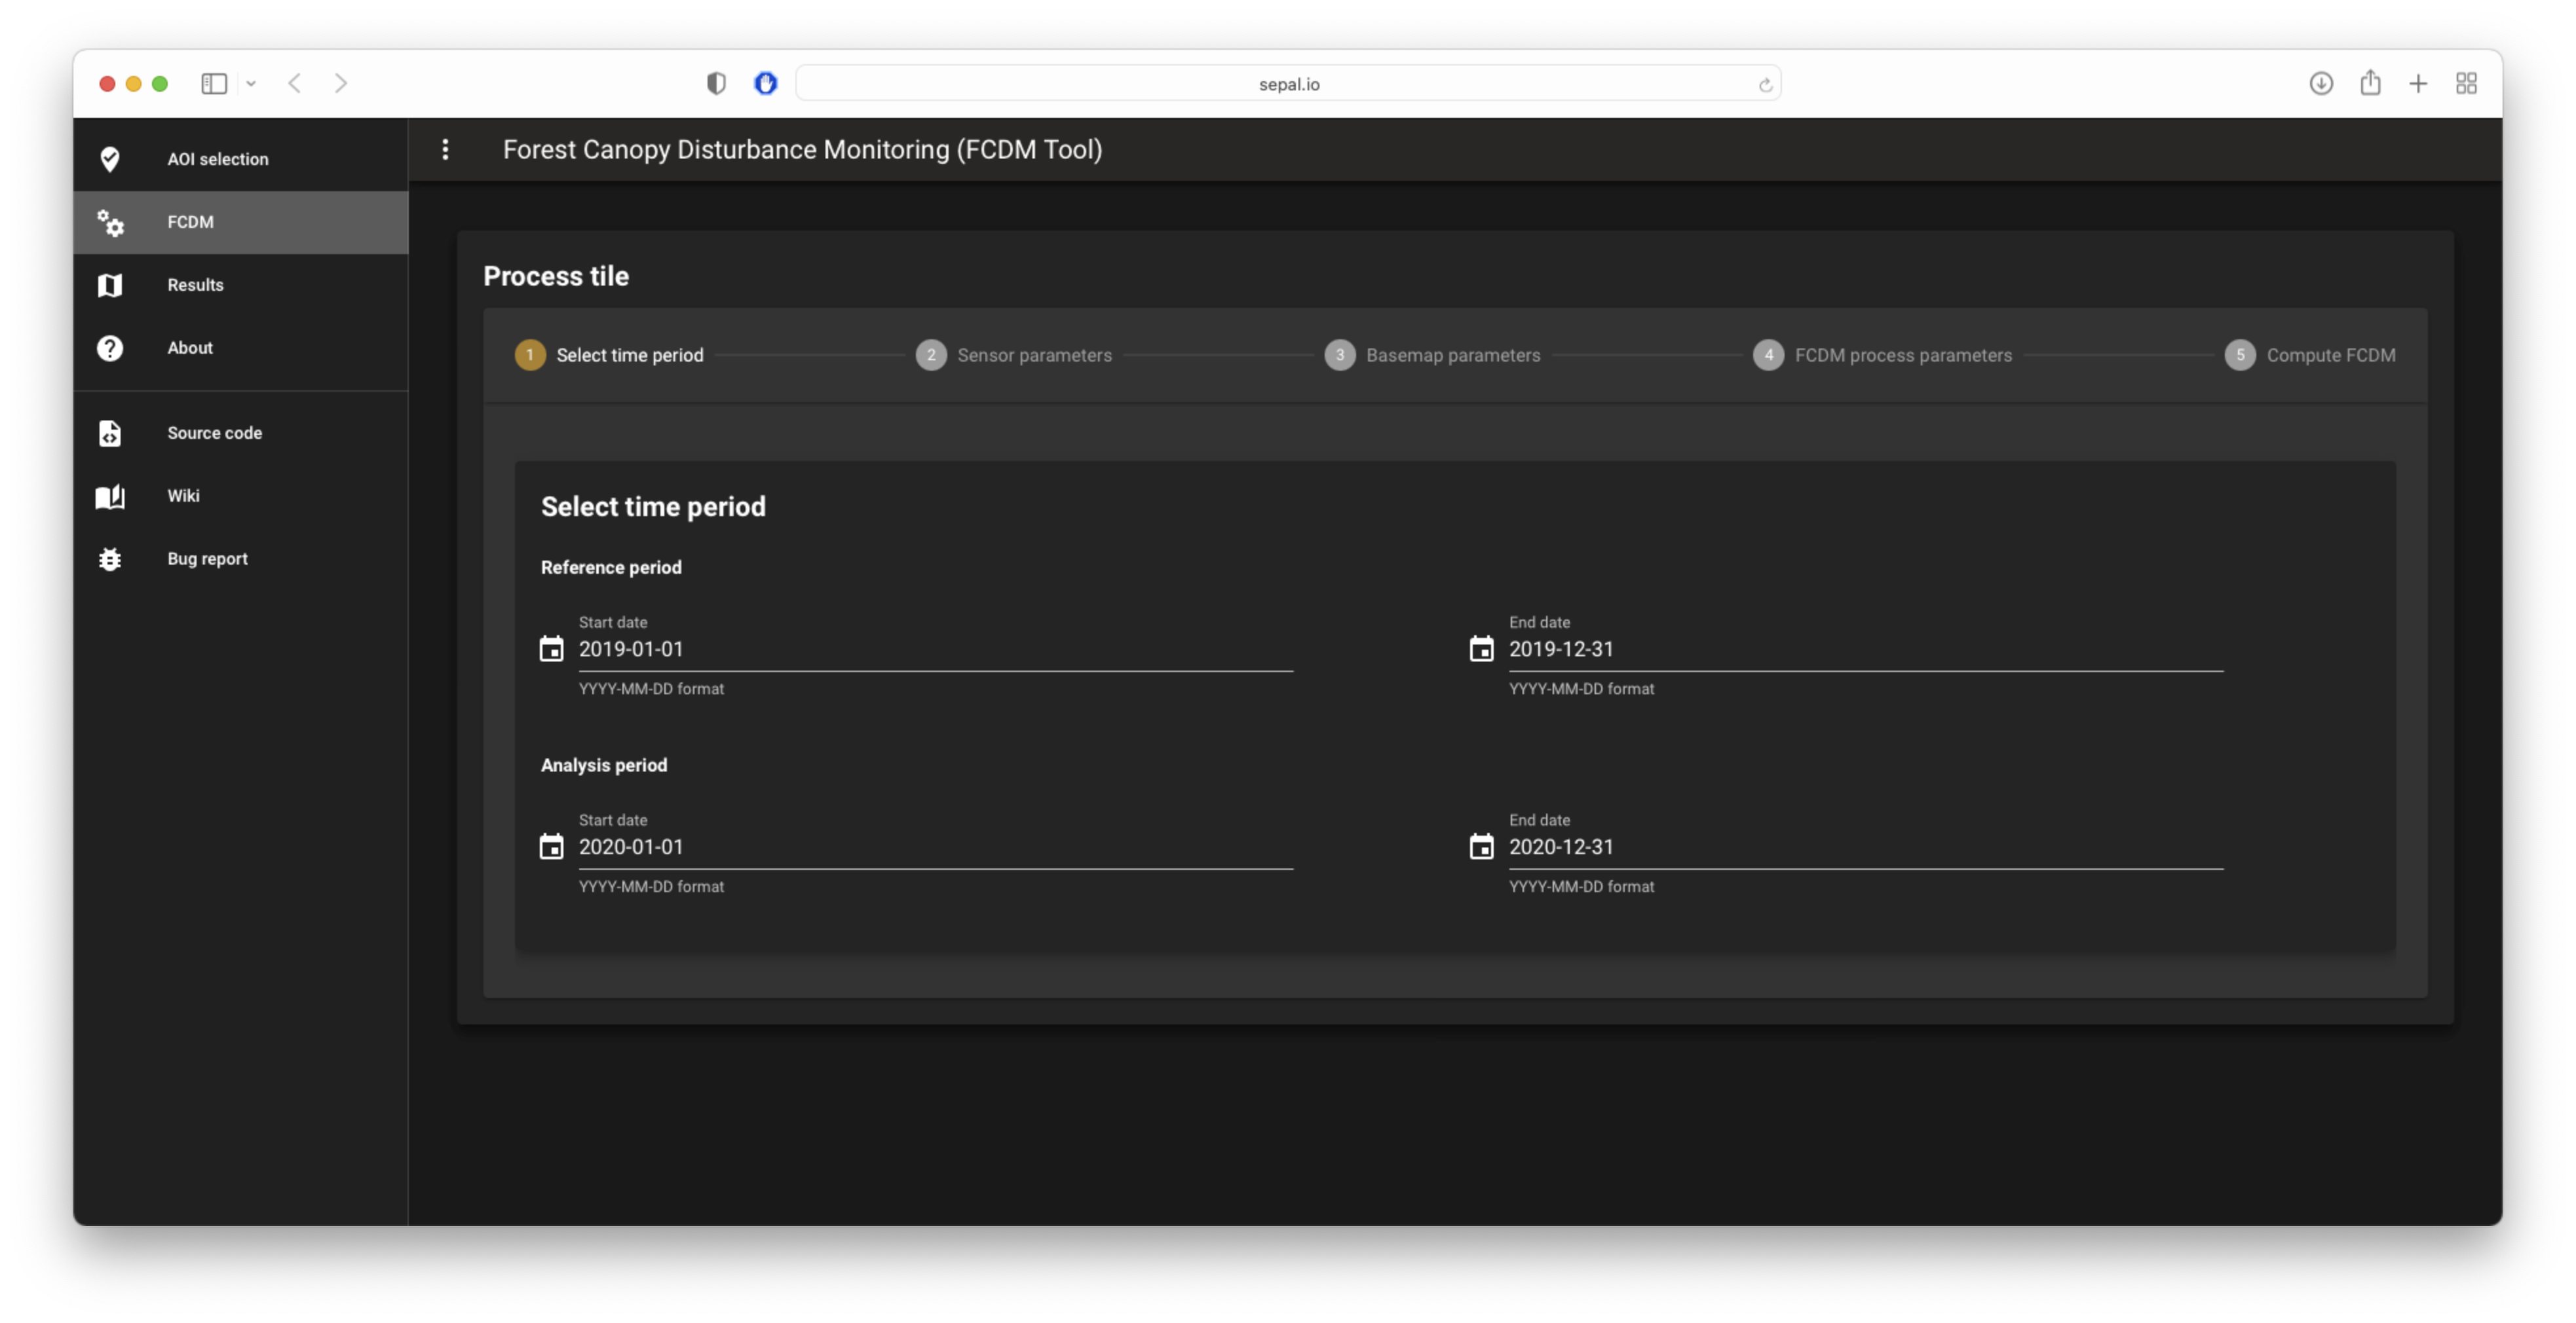
Select time periods#
Selected time periods are periods that will be used as Reference and Analysis periods.
Use the datepicker to select the start and end dates of these time periods.
Note
As suggested in the article, FCDM analysis performs better with time periods smaller or equal to a year. Longer periods tend to accumulate noise. As an example, the following parameters are fitting:
Reference period:
2019-01-01 2019-12-31Analysis period:
2020-01-01 2020-12-31
Sensor parameters#
Sensors#
Attention
The Sensor list is updated with the available satellite dataset for the selected time periods. The user is thus forced to select the dates first.
Sensors can be selected in the dropdown menu. This list is only showing satellite datasets that are available for the selected time period. Select at least one.
Note
Data from Sentinel and Landsat programmes cannot be mixed.
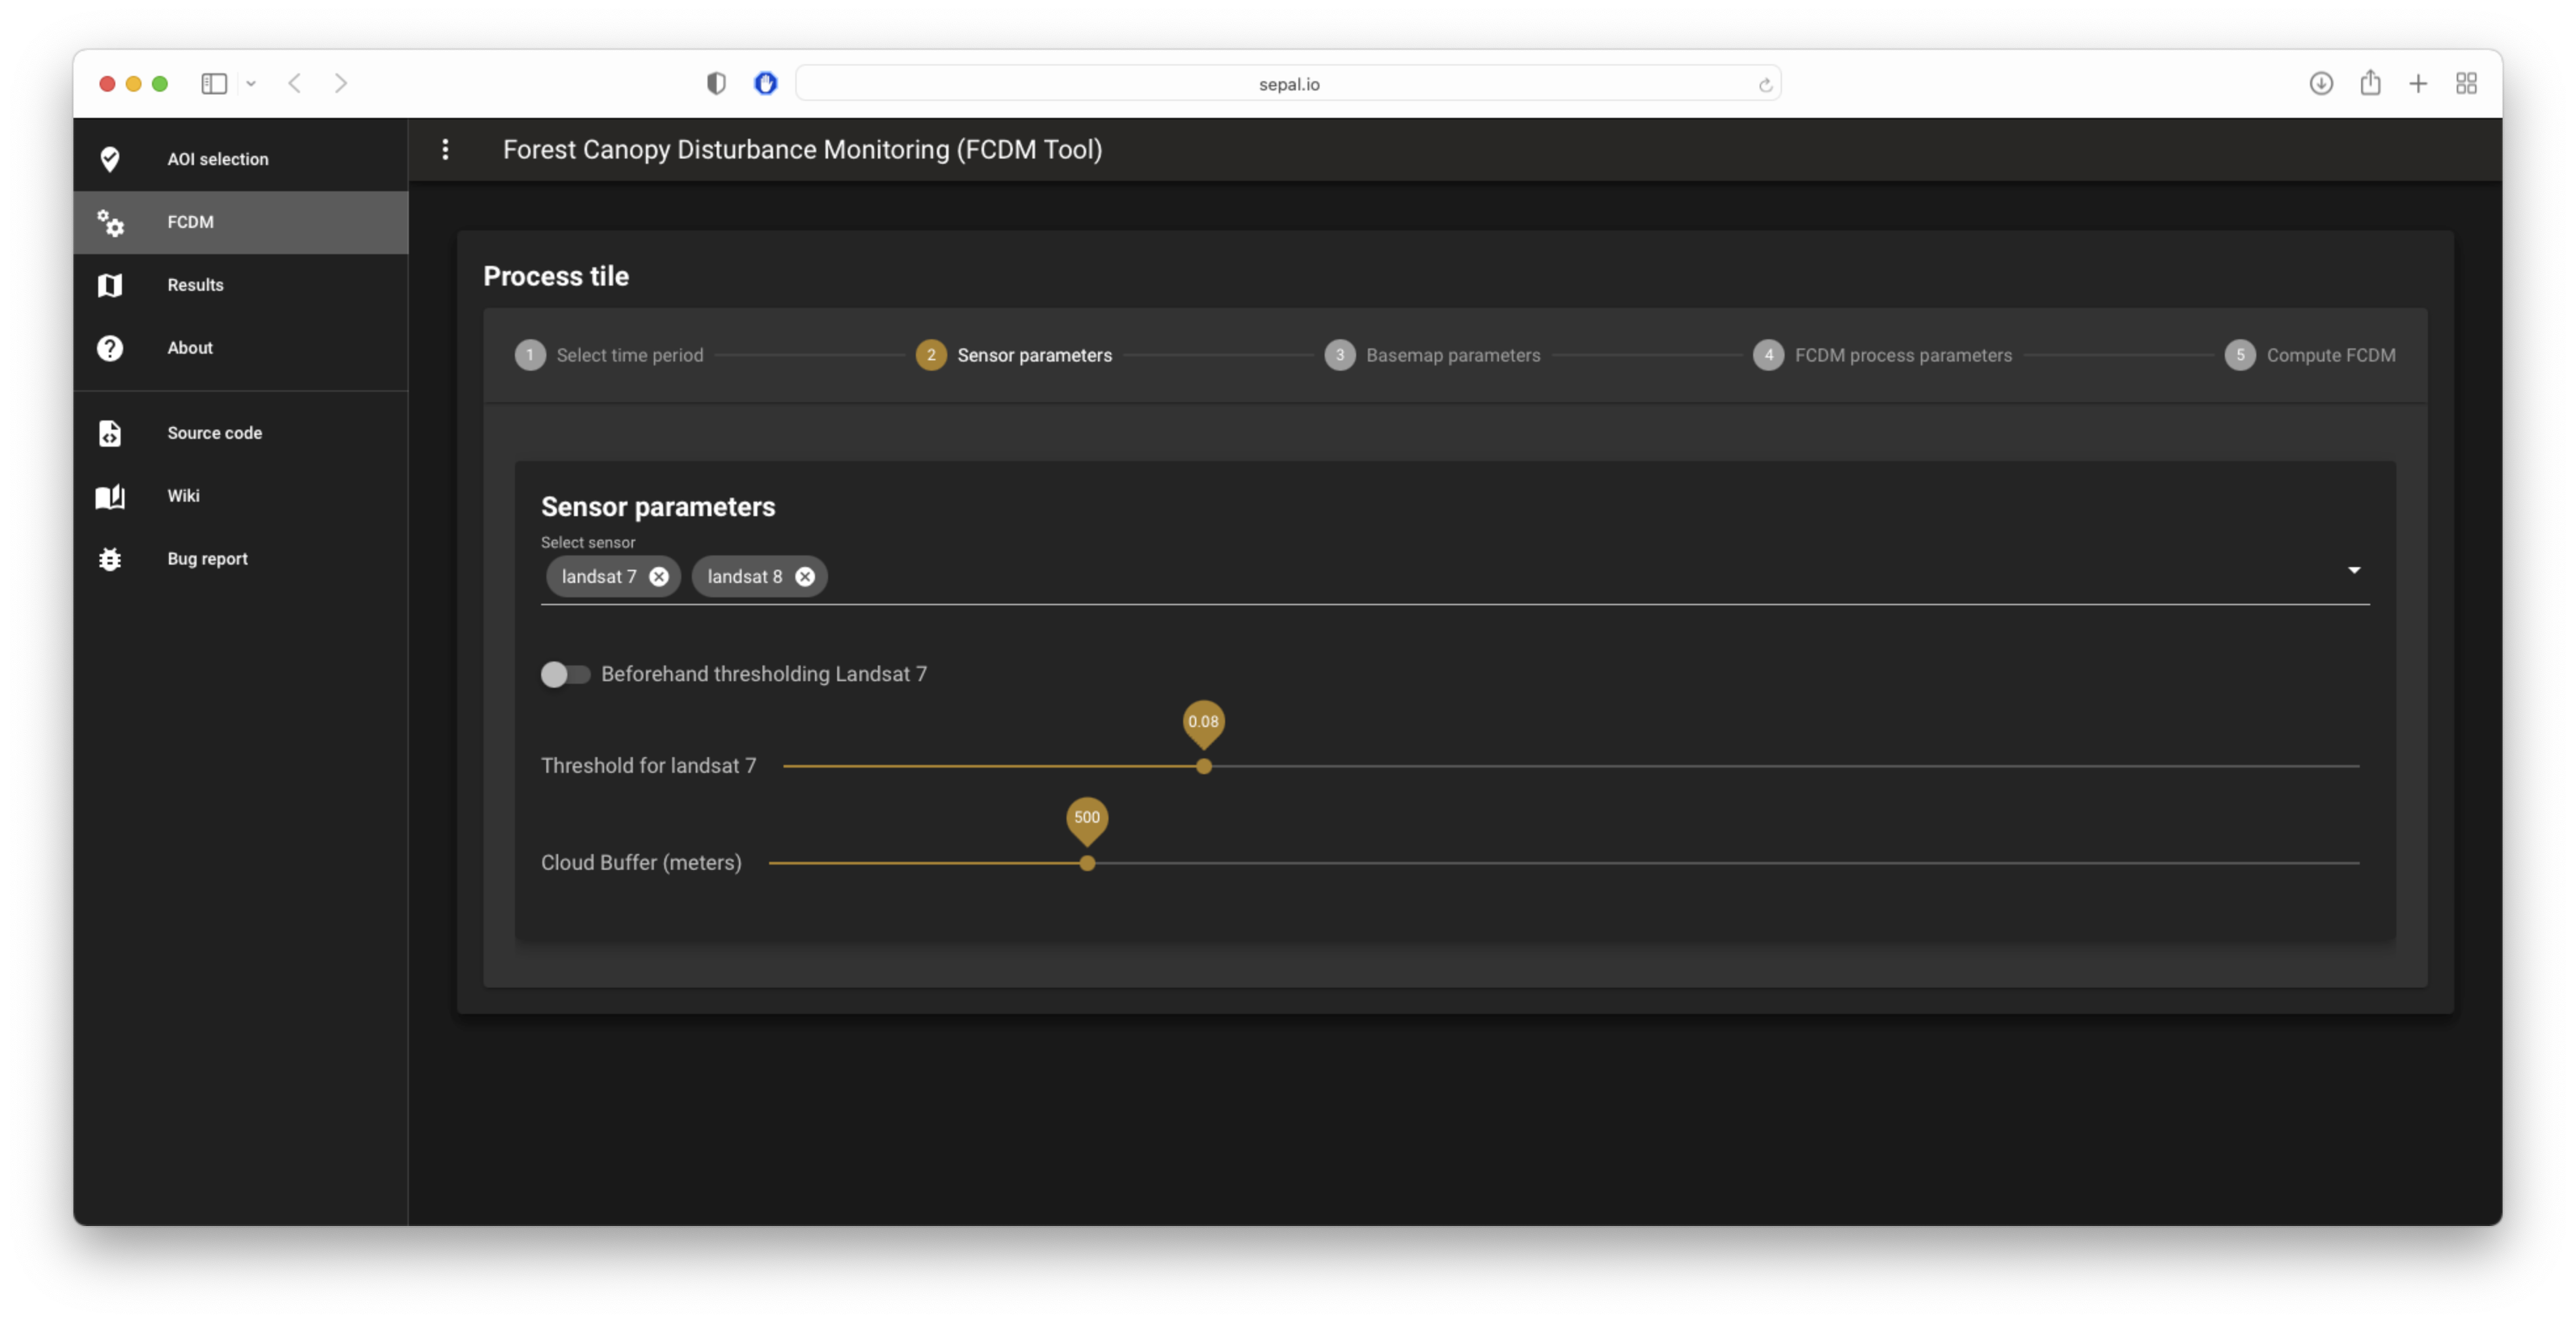
Threshold for Landsat 7#
Value of the threshold applied on Landsat 7 data. This is a correction parameter to remove some of the effects of SLC issues (by default, set to 0.08).
Cloud buffer#
Value of the cloud buffering used in the cloud masking operation of the FCDM process (in metres; by default, set to 500).
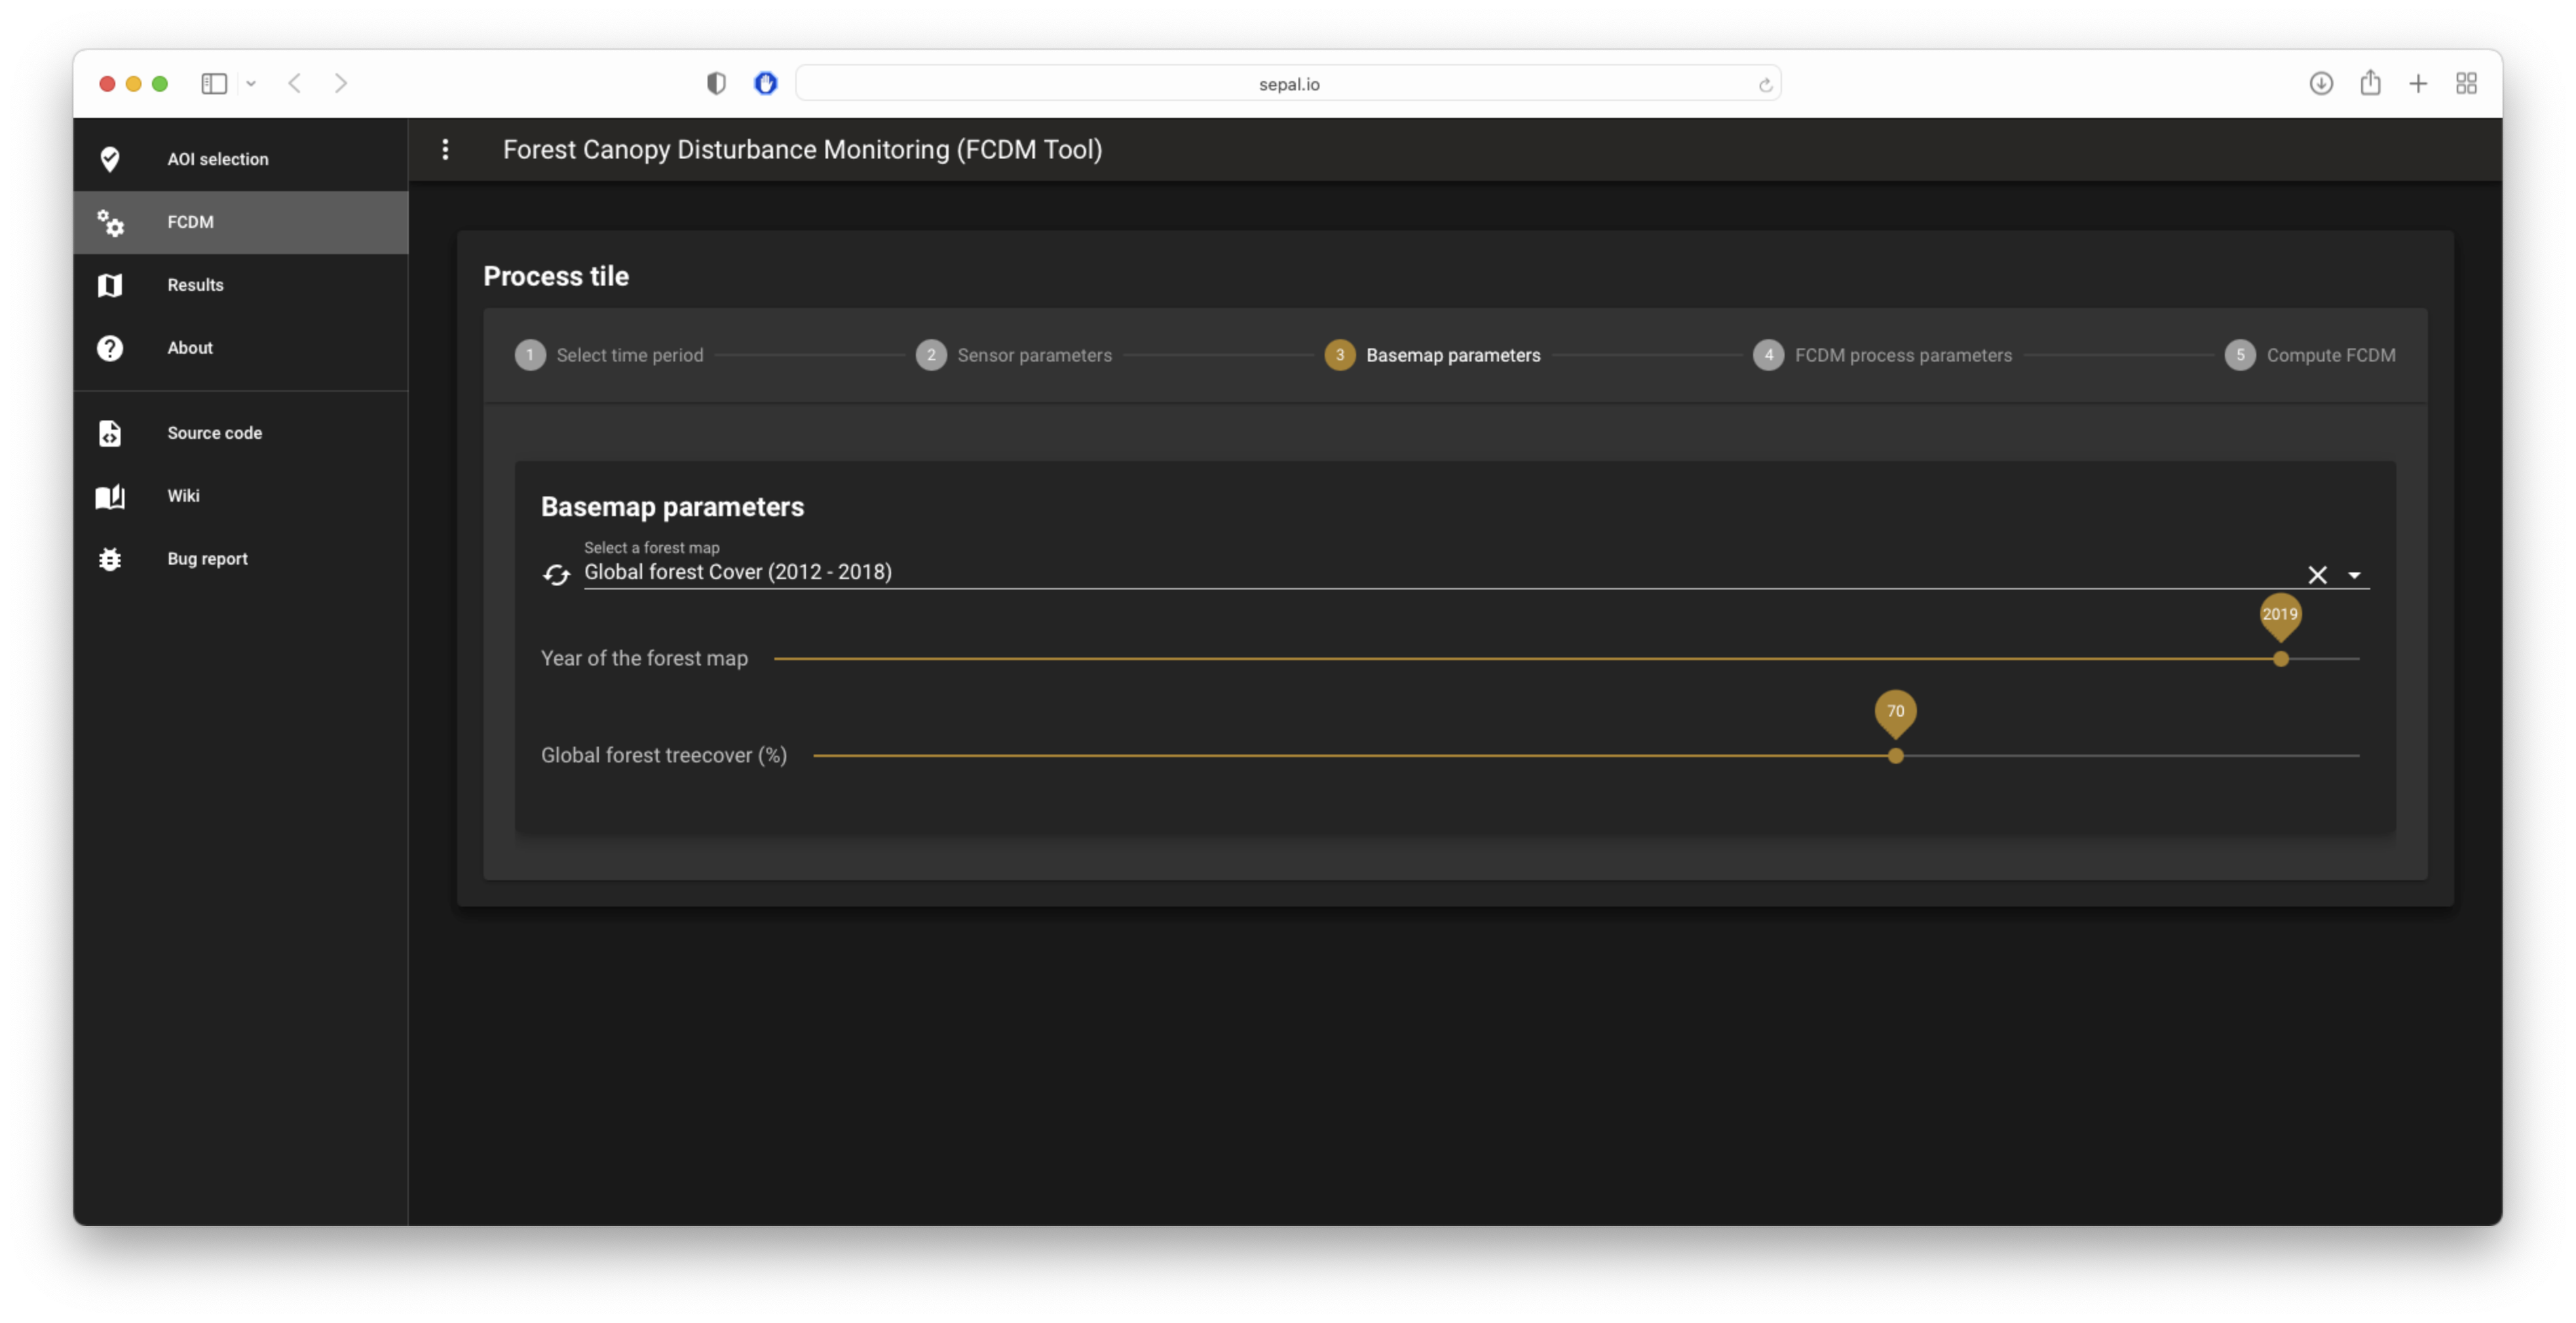
Basemap#
The FCDM process needs to create a Forest/non-forest mask to produce results, which is derived from data provided by the user.
Three default datasets can be selected:
Global forest cover: This mask will be based on the global forest cover product from University of Maryland. The user will also need to provide the year to use and the tree cover level to differentiate forest from the rest.
Tip
The year is automatically set to the start year of the Reference period.
TMF: This mask will be based on the Tropical Moist Forest product from the JRC <https://forobs.jrc.ec.europa.eu/TMF/gee_tutorial/>. The user will also need to provide the year of analysis.
Tip
The year is automatically set to the start year of the Reference period.
No forest map: There will be no forest masking.
The user can also use any GEE asset by setting its value in the textfield or selecting an image in the Raster list. The image needs to be a mask with values of the first band set to:
0 for non-forest
1 for forest
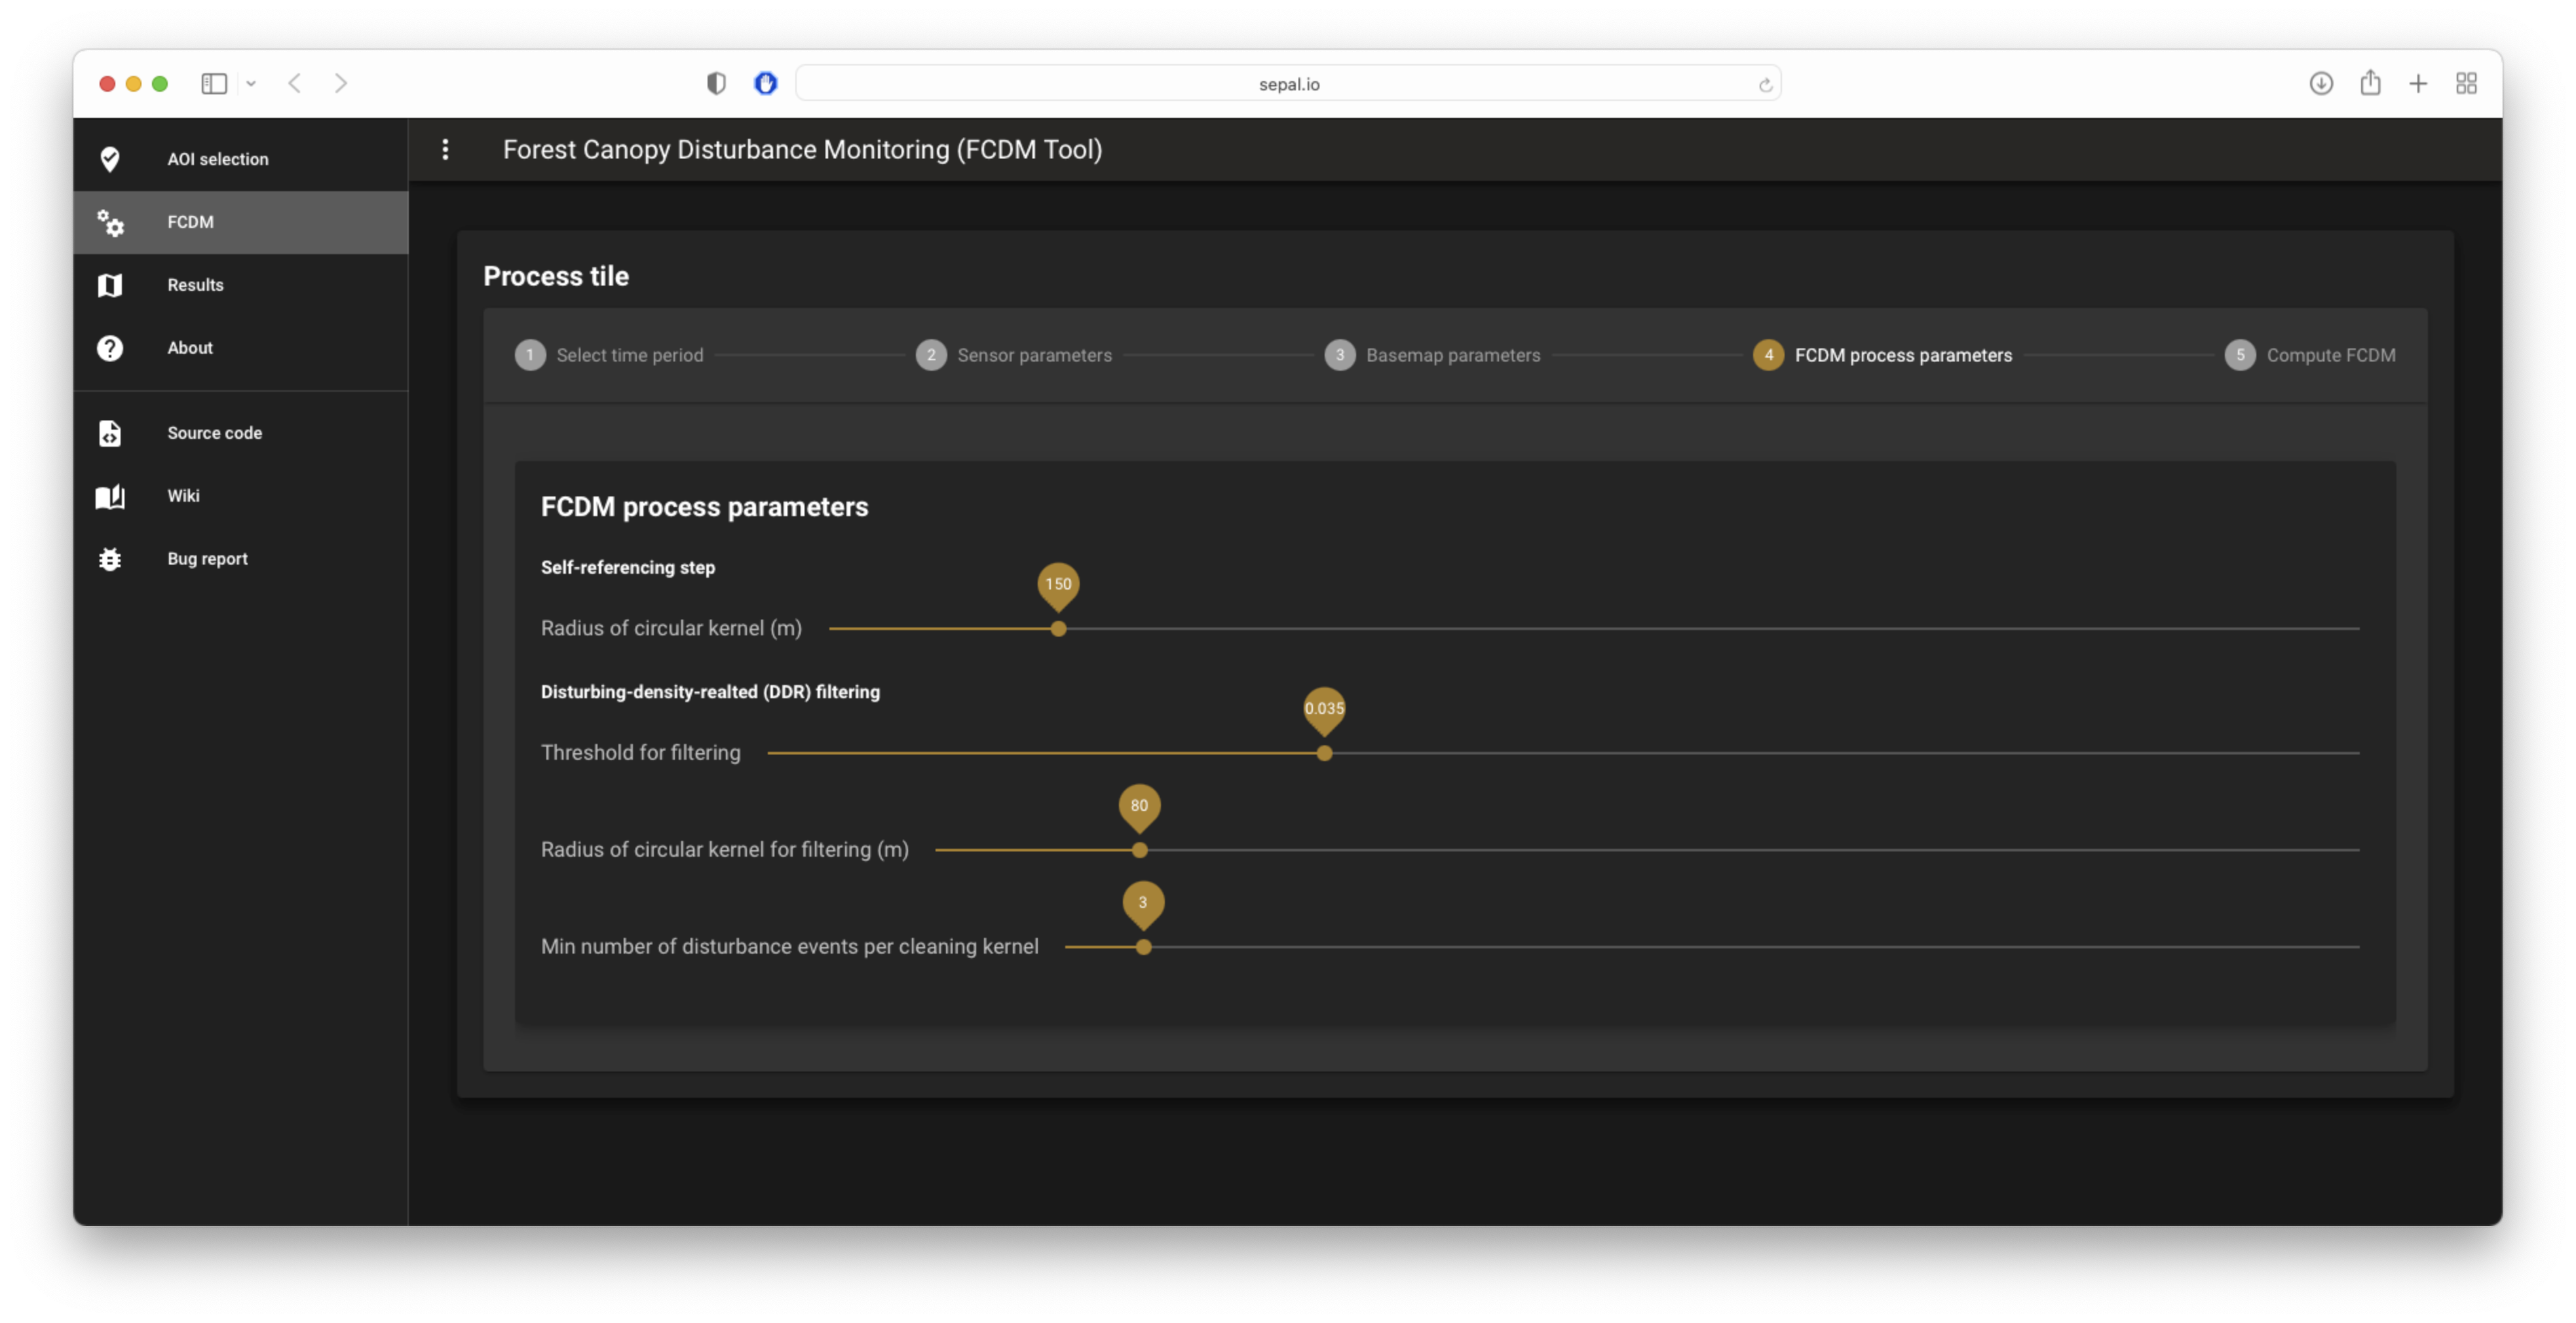
Advanced parameters#
These are the advanced parameters of the FCDM process.
Please read this section carefully to understand their objectives.
Self-referencing#
For the self-referencing kernel, set one parameter – Radius of circular kernel – which will define the buffer used for the self-referencing operation (in metres; by default, set to: code:150).
DDR#
Note
Disturbance-Density-Realted (DDR) filtering
Three parameters need to be set:
Threshold for filtering: The threshold of change magnitude that will be considered as intermediate disturbance results (by default,
0.035).Radius of circular kernel for filtering: The radius of the buffer (in metres; by default, to: code:80).
Min number of intermediate disturbance events per cleaning kernel: the threshold number of intermediate disturbance events within a kernel to consider the kernel centre pixel to be kept or discarded (irrespective of pixel value; by default, set to
3).
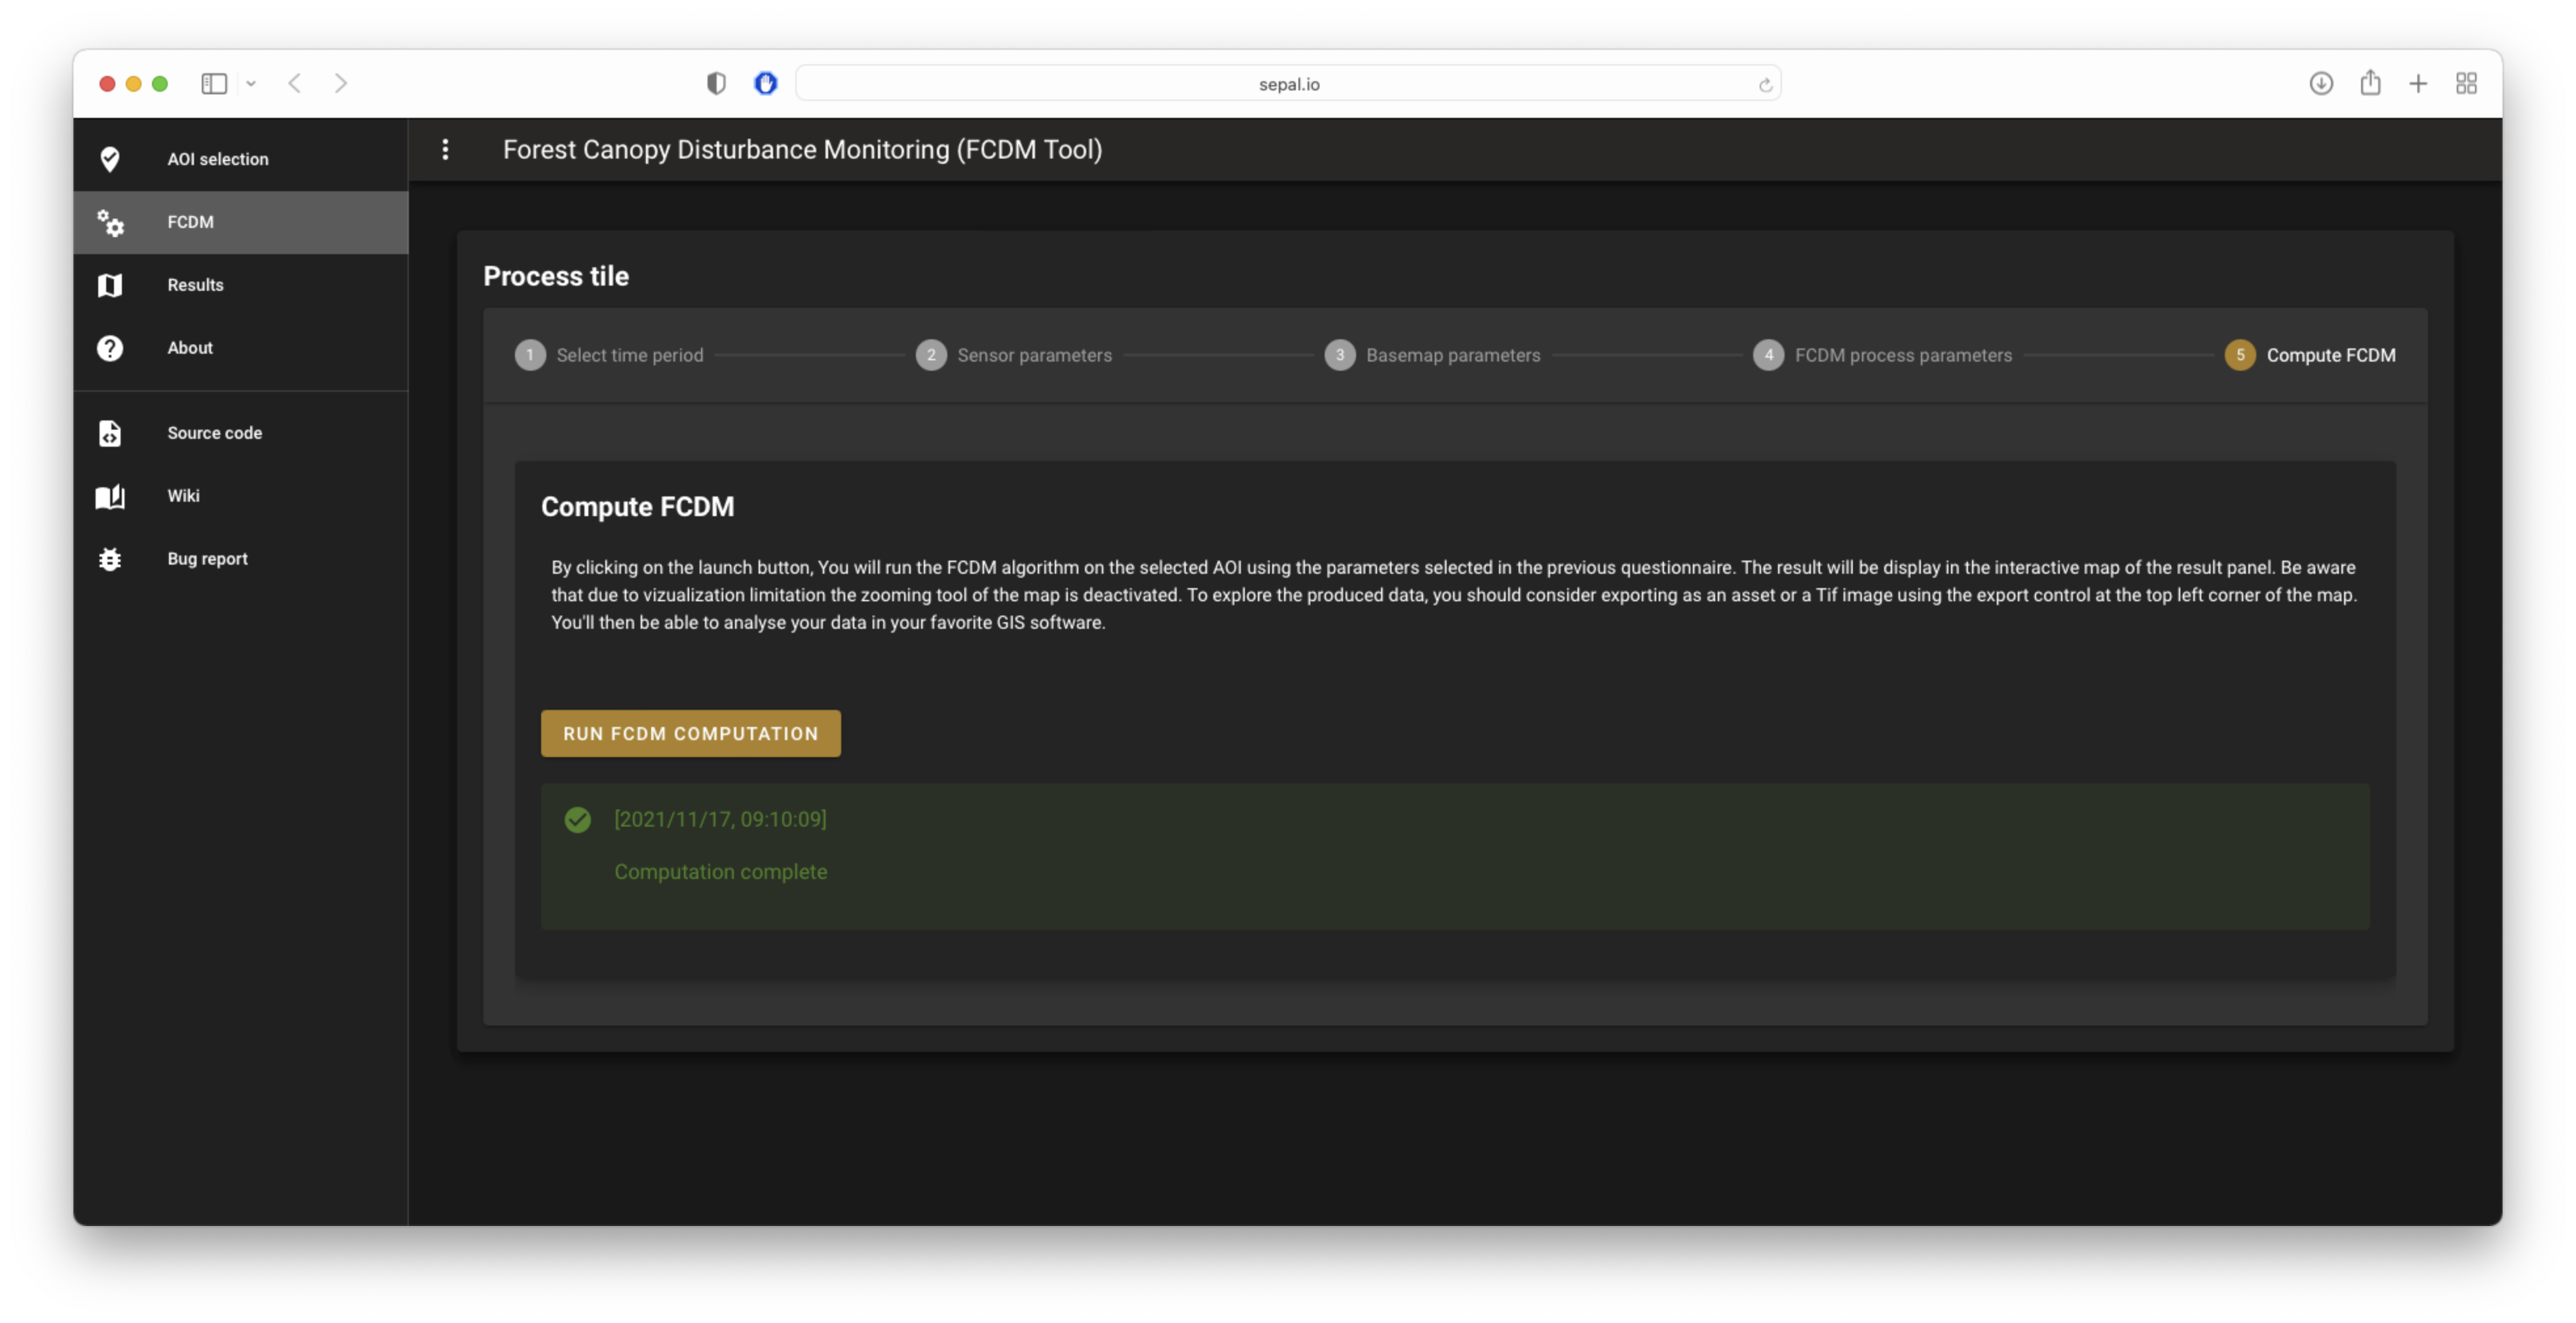
Compute#
Select Run FCDM Computation to launch the process in GEE. The layers will automatically be displayed on the visualization map.
Note
This operation takes very little time since the actual computation is done when the map refreshes itself.
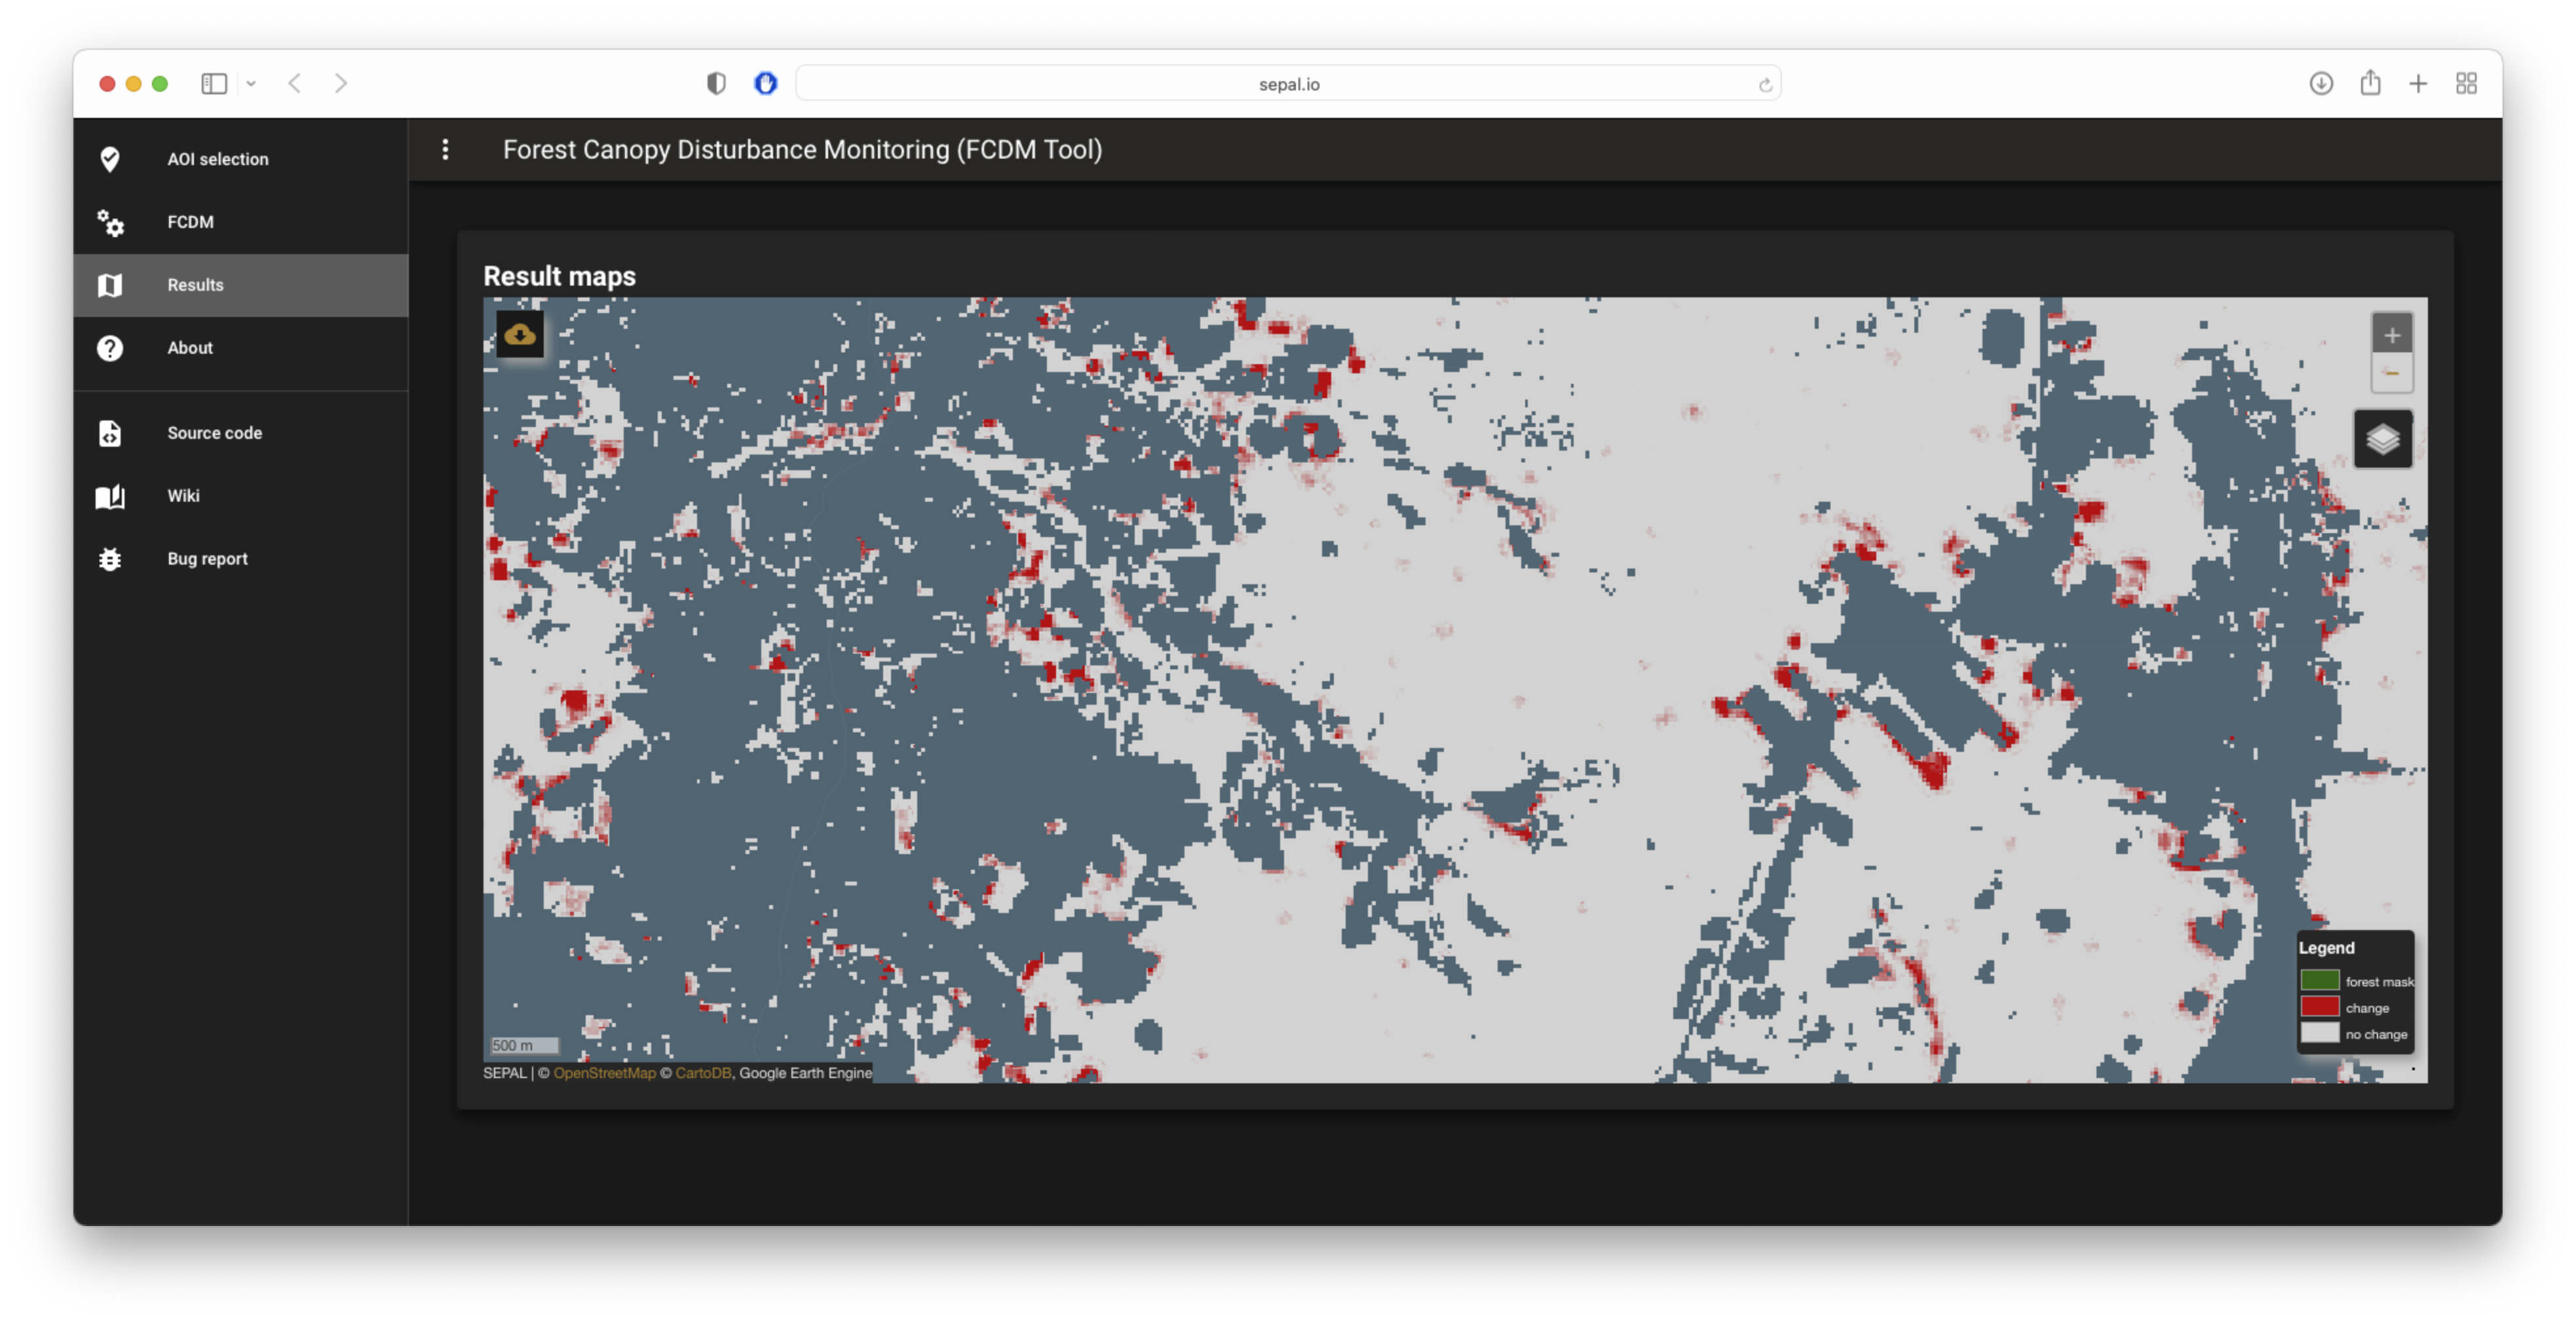
Map#
In this map, different layers of the computation will be displayed:
the forest mask (in green)
the Delta-rNBR (in red, where there are disturbances)
the AOI (in light blue)
Note
When the map is fully zoomed out, the disturbances are not visible because of the GEE pyramiding policy. Zoom in two to three times to see the disturbances.
Attention
Every time the user zooms in, GEE will recompute all values on the fly. This operation is time consuming, so be patient. The forest mask is a simple image; when the Delta-rNBR finishes refreshing, it will be perfectly aligned with the image (if it’s blurry, GEE is still computing).
Download images#
Select the cloud in the upper-left corner of the map to open the following pop-up window, where you will be able to customize exportation parameters.
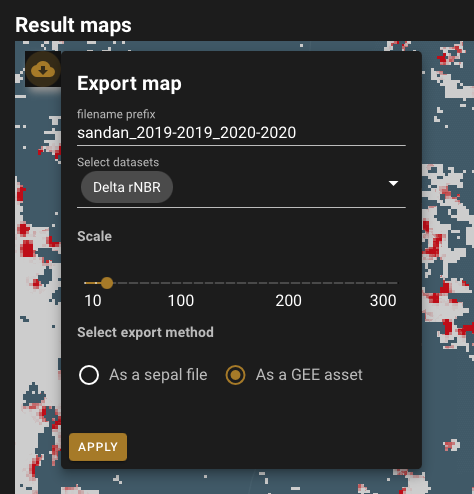
Filename prefix: The prefix used to describe the file (in SEPAL) or asset (in GEE) (by default,
<aoi_anme>_<referenced perdiod year>_<analysis_period_year); it can be customized to anything, but every non-UTF8 character will automatically be changed to “_”.Select dataset: The user can export any of the following datasets:
Delta-rNBR,Delta-rNBR wihthout DDR,anaysis rNBR,reference rNBR, andforest mask(by default,Delta-rNBR).Scale: The user can select any exportation scale (from 10–300 m).
Select export method: SEPAL file or GEE asset
Attention
If you select
as a SEPAL file, the application cannot be closed before the end of the exportation.If you choose to export to GEE, the process can be monitored from the GEE Task manager.
Select Apply to start the exportation process.