Forest change mask#
Base forest mask and fragmentation tool
As a base forest mask and fragmentation tool, this application allows users to:
define an area of interest (AOI);
retrieve tree cover change data from the Hansen et al. (2013) dataset; and
combine layers to produce a forest change map for a given canopy cover threshold.
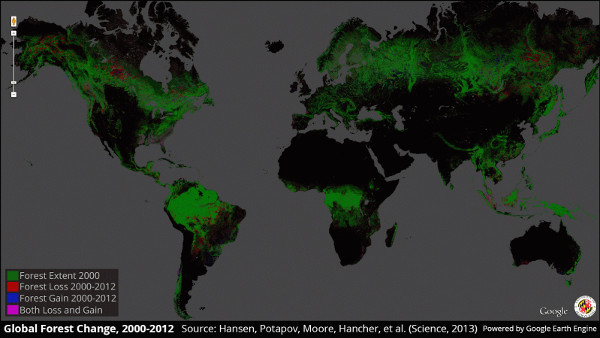
Background information on Global Forest Change#
Global forest change (GFC) provides global layers of information on tree cover and tree cover change since 2000 (at 30 m spatial resolution), consisting of:
tree canopy cover for the year 2000 (treecover2000);
global forest cover gain for 2000–2012 (gain); and
year of gross forest cover loss event (lossyear).
For more information, please refer to:
Hansen, M.C. et al. 2013. High-Resolution Global Maps of 21st-Century Forest Cover Change. Science, 342: 850–53. https://science.sciencemag.org/content/342/6160/850
University of Maryland, Global forest change dataset
Usage#
Select an AOI#
Using the provided AOI selector, choose an AOI of your choice between different methods available in the tool.
We provide three administrative descriptors (from level 0 to 2) and three custom shapes (drawn directly on the map, asset, or shapefile).
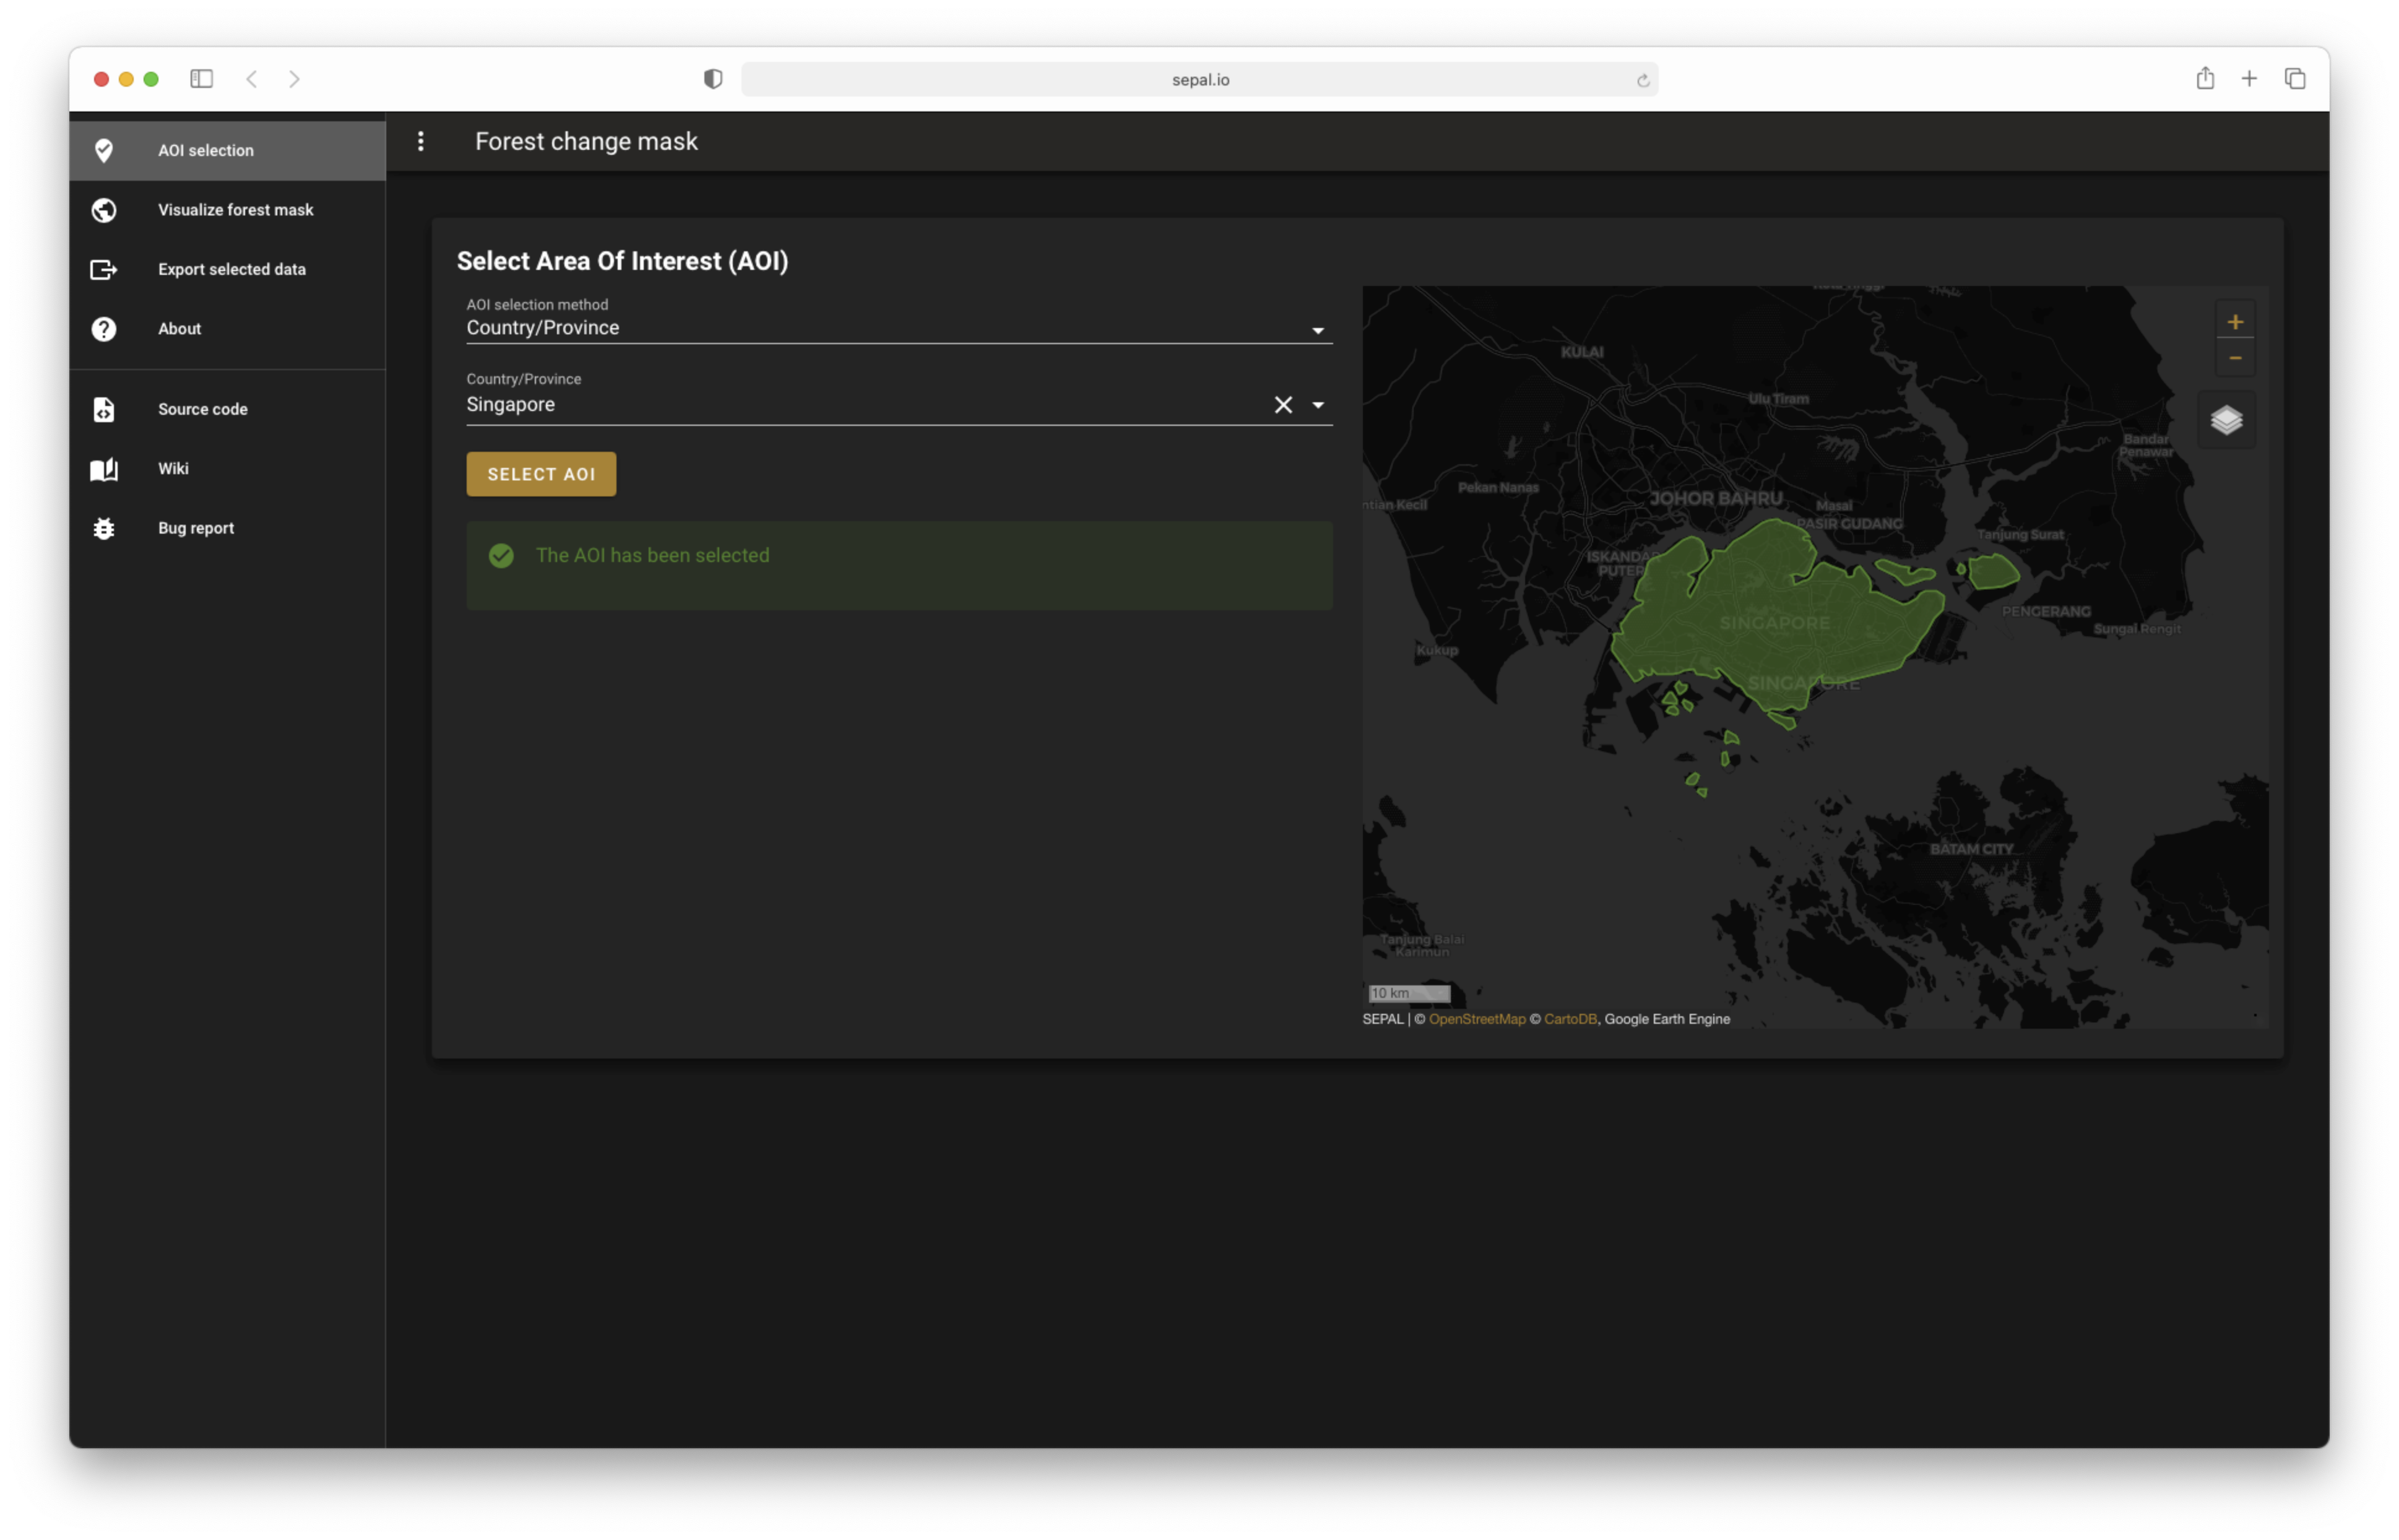
Note
If a custom AOI from a shape or drawing is selected, you can use it directly; the upload to GEE will be launched in the background. Check your GEE code editor to use it elsewhere.
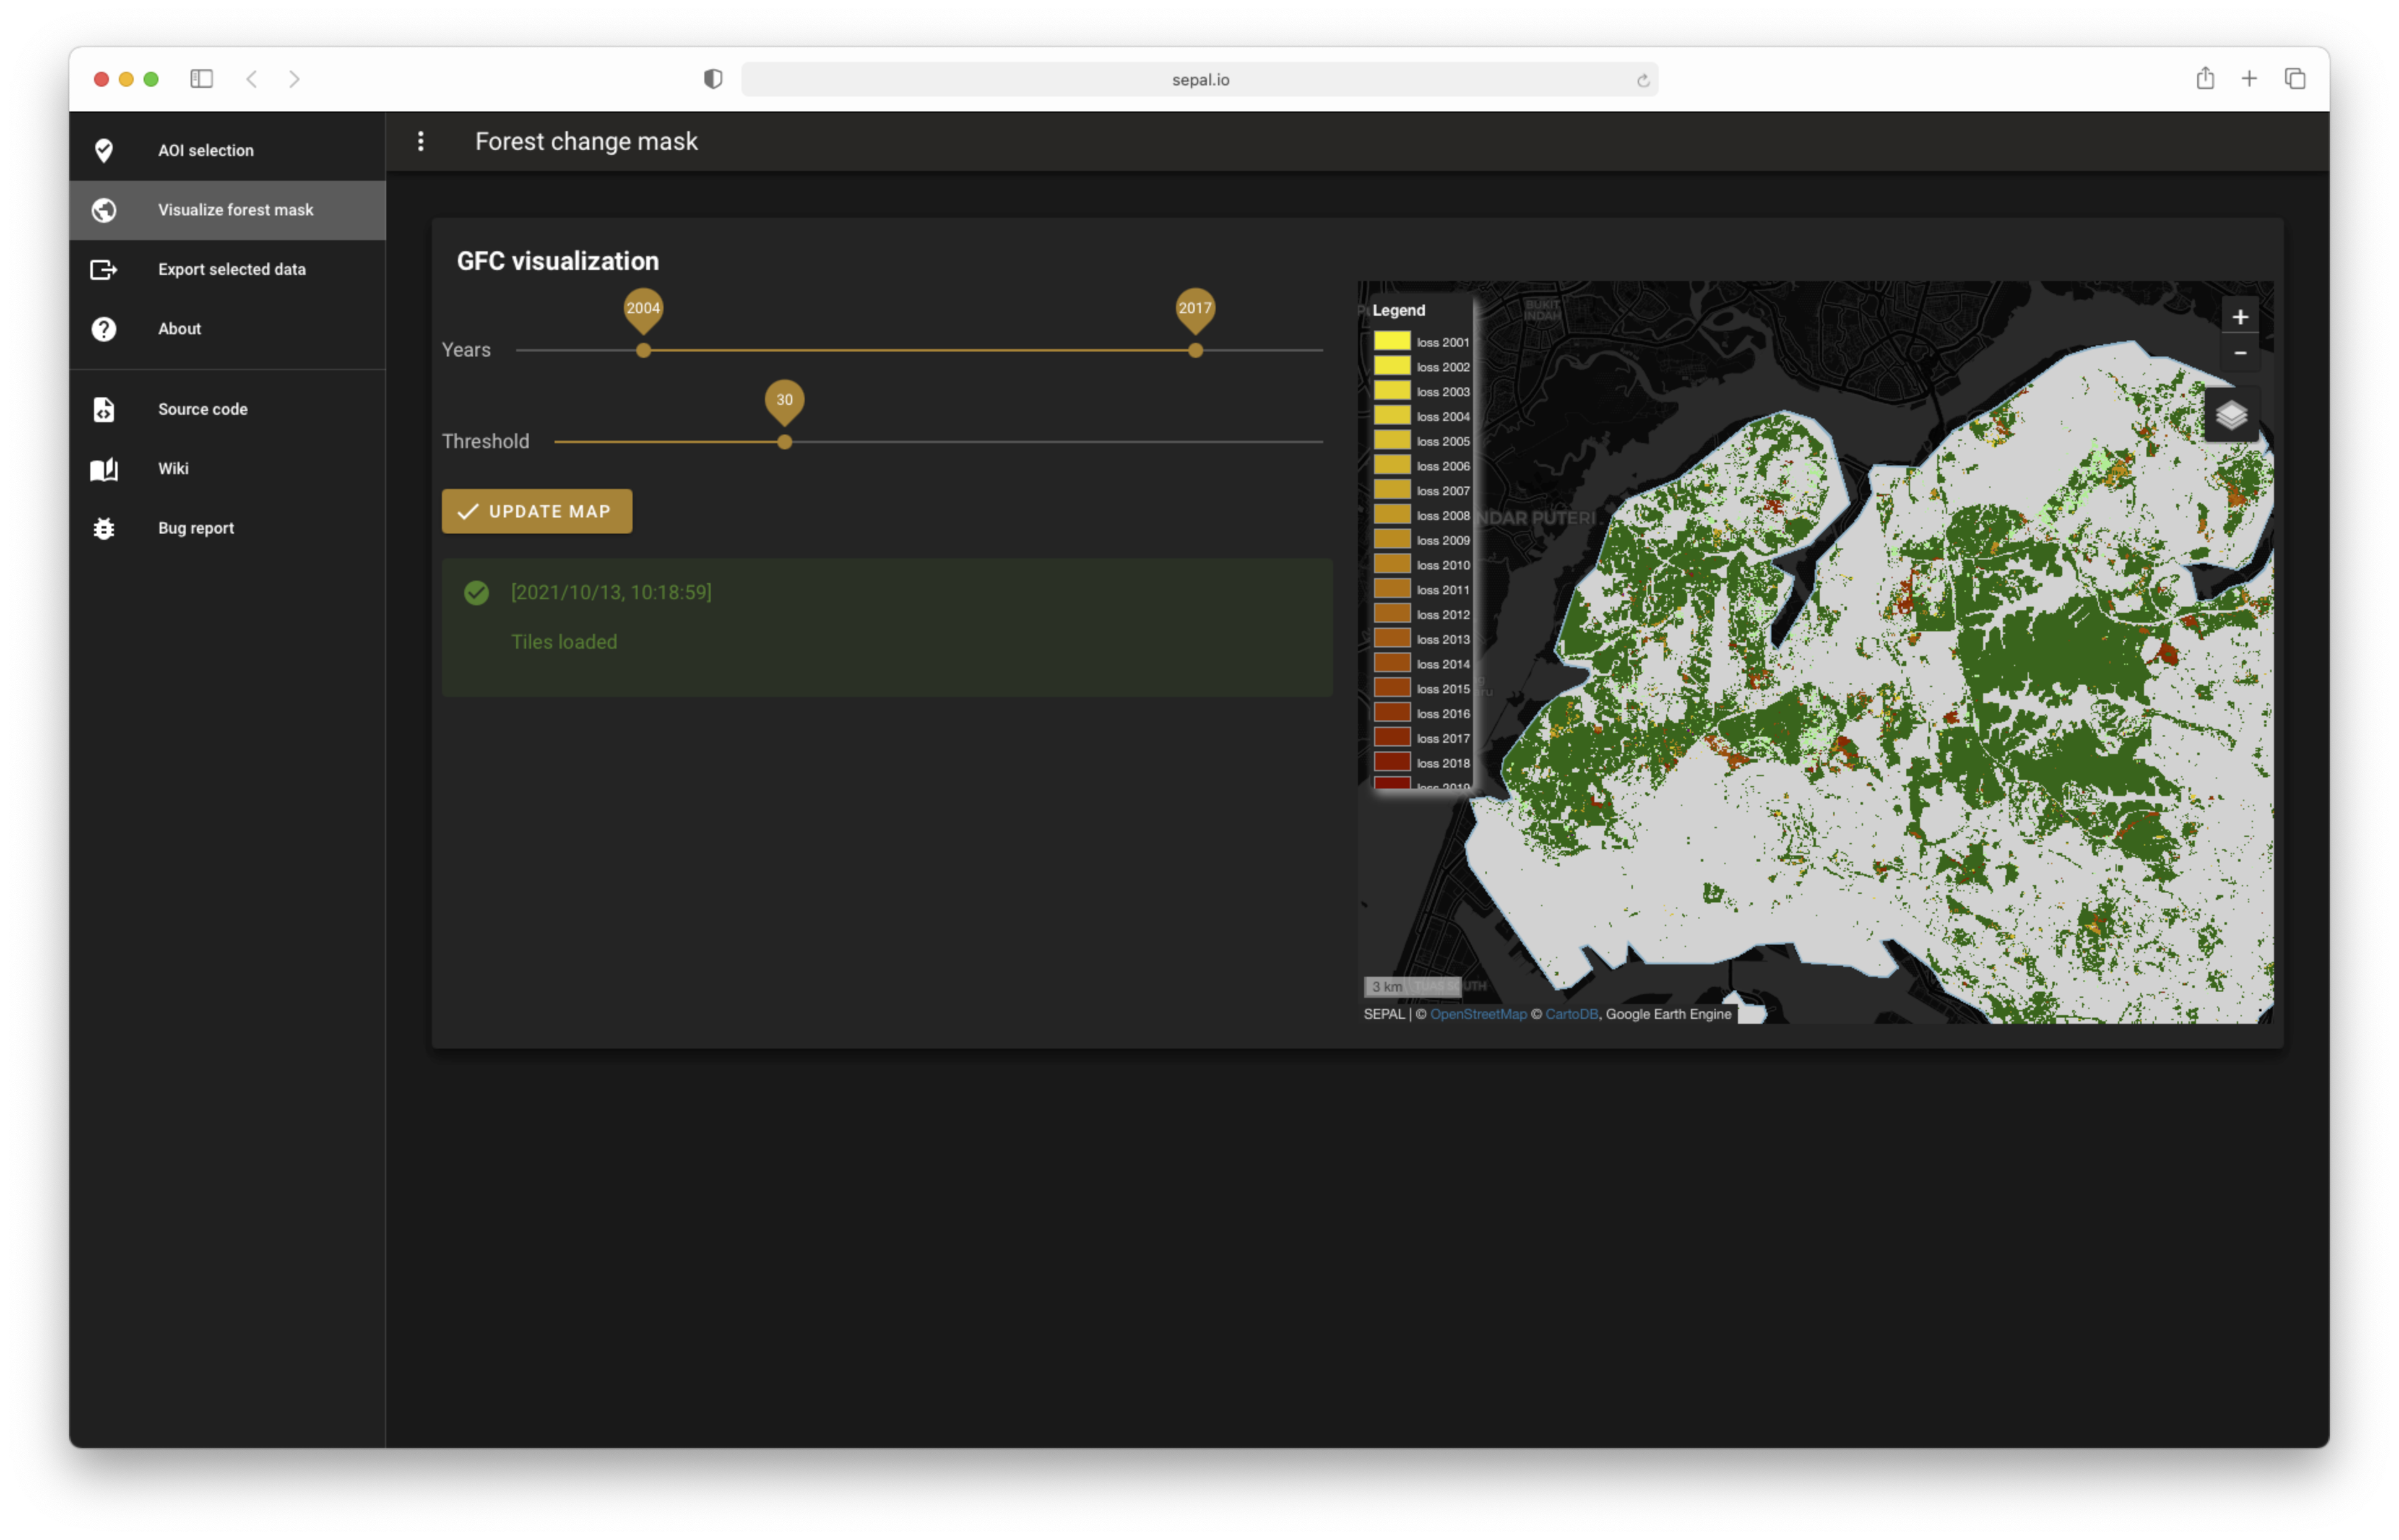
GFC visualization#
Two parameters are available to select the data:
Use the slider to change the threshold to consider (between forest and non-forest areas). Once you’ve chosen a value, select
update mapto update the interactive map layers.Use the range slider to move the dates to consider in the analysis.
The new layer is a combination of GFC layers to produce a forest change map for a given canopy cover threshold. Only pixels that have tree cover above the threshold will be considered forest. Every tree-covered pixel prior to the start date will be considered as non-forest and every changed that occurs after the end date will be considered stable forest. The legend is displayed in the map. You’re allowed to zoom in and out; the data will be recomputed dynamically in GEE.
When changing the value of the threshold or the dates, a new layer will be added to the map, so you can compare and select the most appropriate parameters for your analysis.
Attention
The parameters that will be used for the next step are the final values requested of the threshold. To return to a previous value, move the slider back and select update map again.
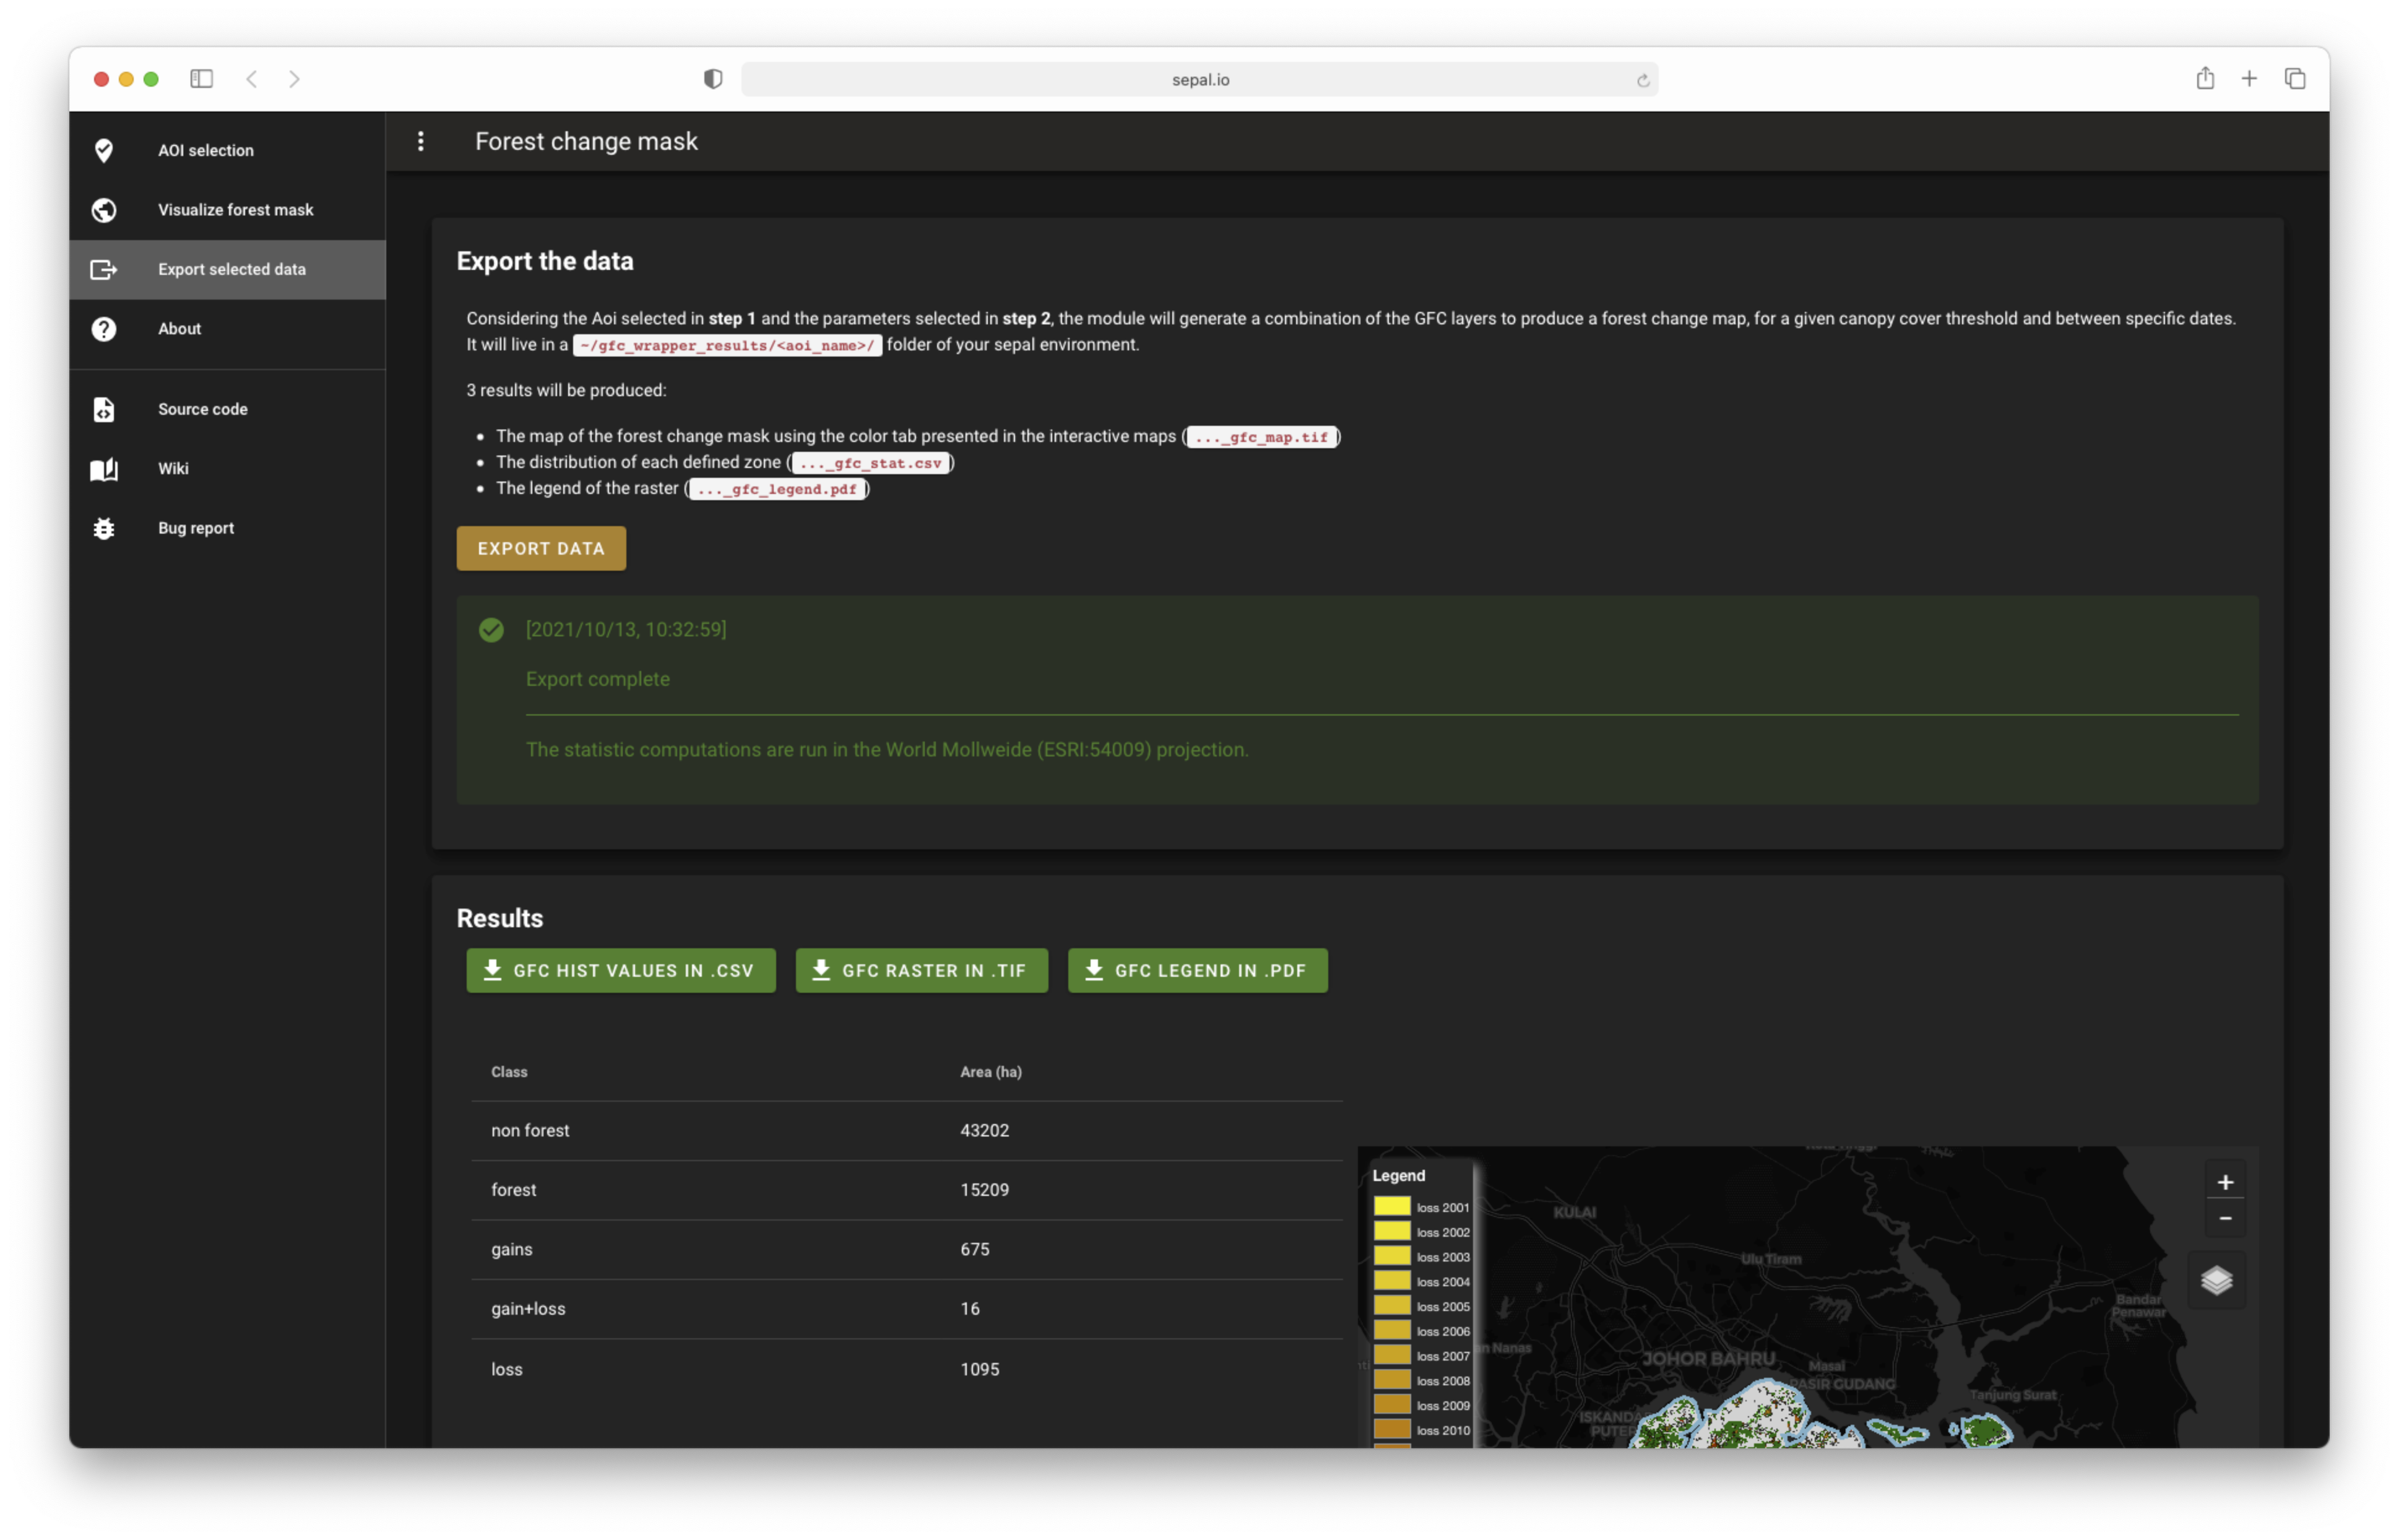
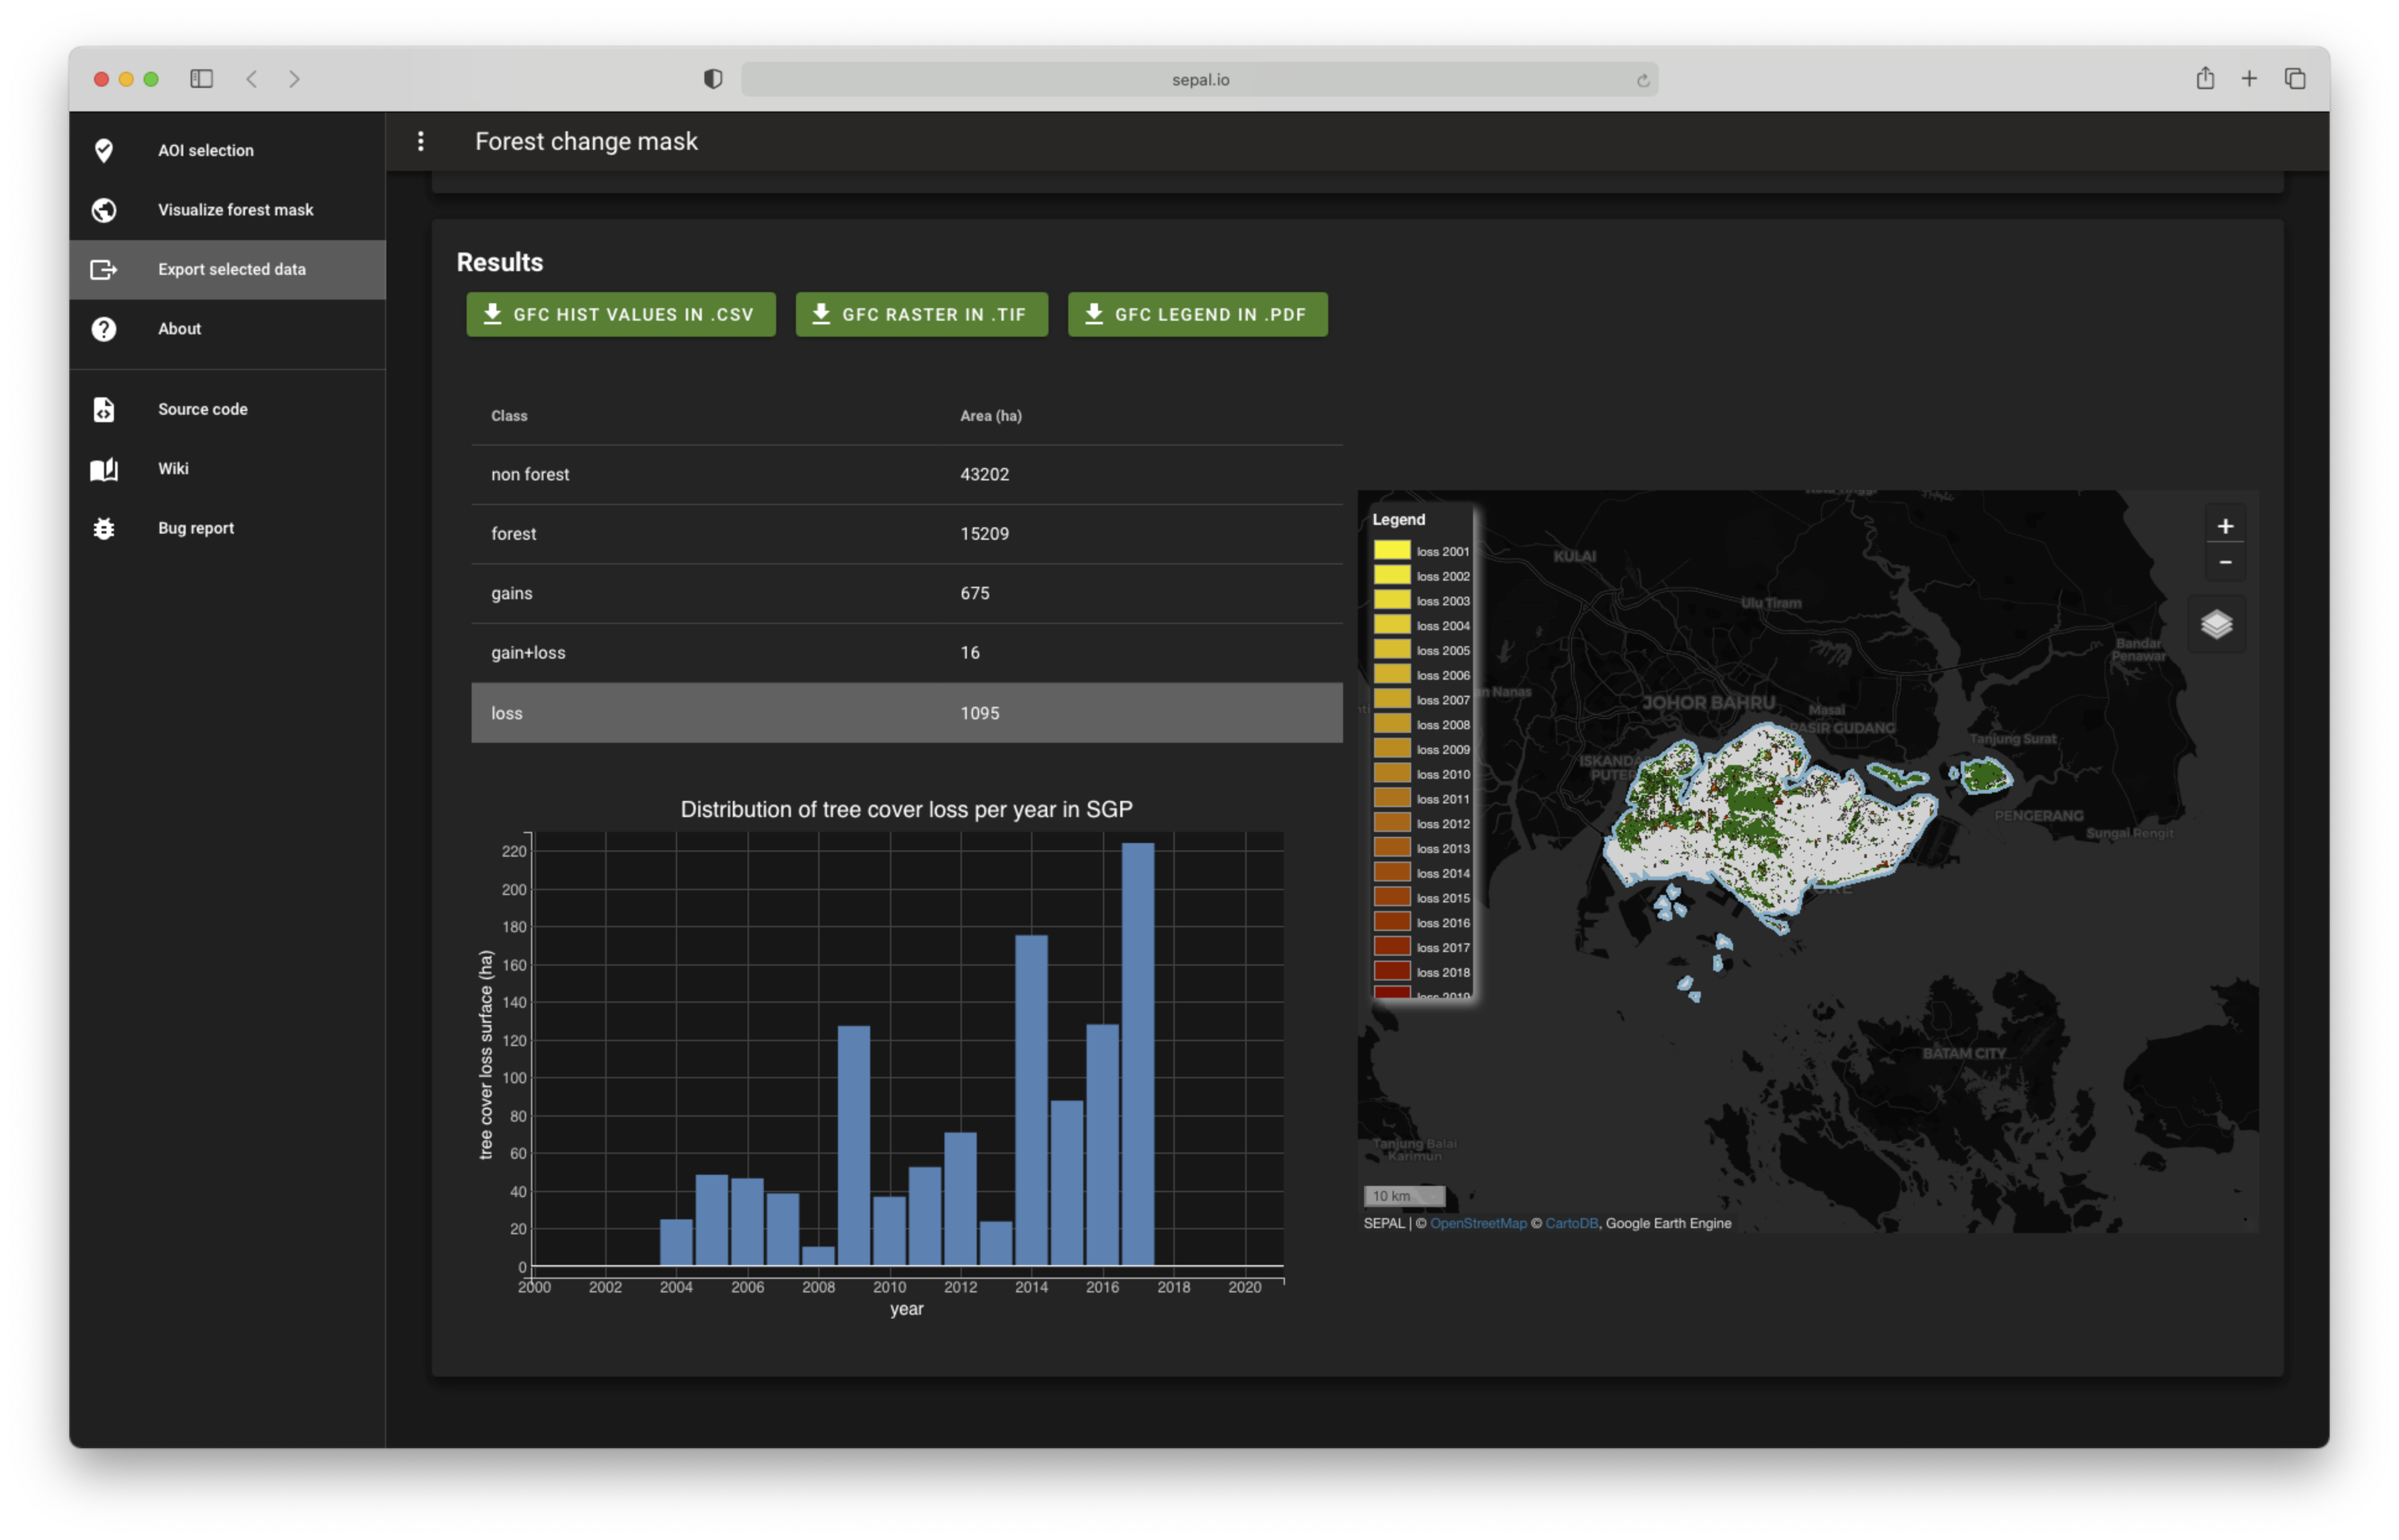
Export selected data#
Considering the AOI selected in Step 1 and the parameters selected in Step 2, the module will generate a combination of GFC layers to produce a forest change map for a given canopy cover threshold between specific dates. It will be stored in a ~/gfc_wrapper_results/<aoi_name> folder in your SEPAL environment.
Three results will be produced:
the map of the forest change mask using the color tab presented in the interactive maps (
..._gfc_map.tif`);the distribution of each defined zone (
..._gfc_stat.csv); andthe legend of the raster (
..._gfc_legend.pd``).
Download these three files directly from the interface using the green buttons.
The files are named after your parameters, following this convention: <threshold>_<start_date>_<end_date>_<file>.<suffix>
Attention
The statistic computations are run in the World Mollweide (ESRI:54009) projection. The results may differ if you want to get them in a local projection.