

Coverage analysis tool for optical data#
Check per-pixel data availability
This module uses the sepal_ui framework and interactive Voila dashboard to create maps of cloud-free observations for major optical satellites available on the Google Earth Engine (GEE) platform.
The framework follows the logic of BFAST’s countObs and summaryBrick functions, as described here (BFAST refers to Breaks For Additive Season and Trend).
For more information about BFAST, see Schultz et al. (2013).
The three-step process is described in the following sections.
Select an area of interest (AOI)#
Using the provided AOI selector, select an AOI from the available methods. We provide three administrative descriptors (from level 0 to 2) and three custom shapes (drawn directly on the map, asset or shapefile).
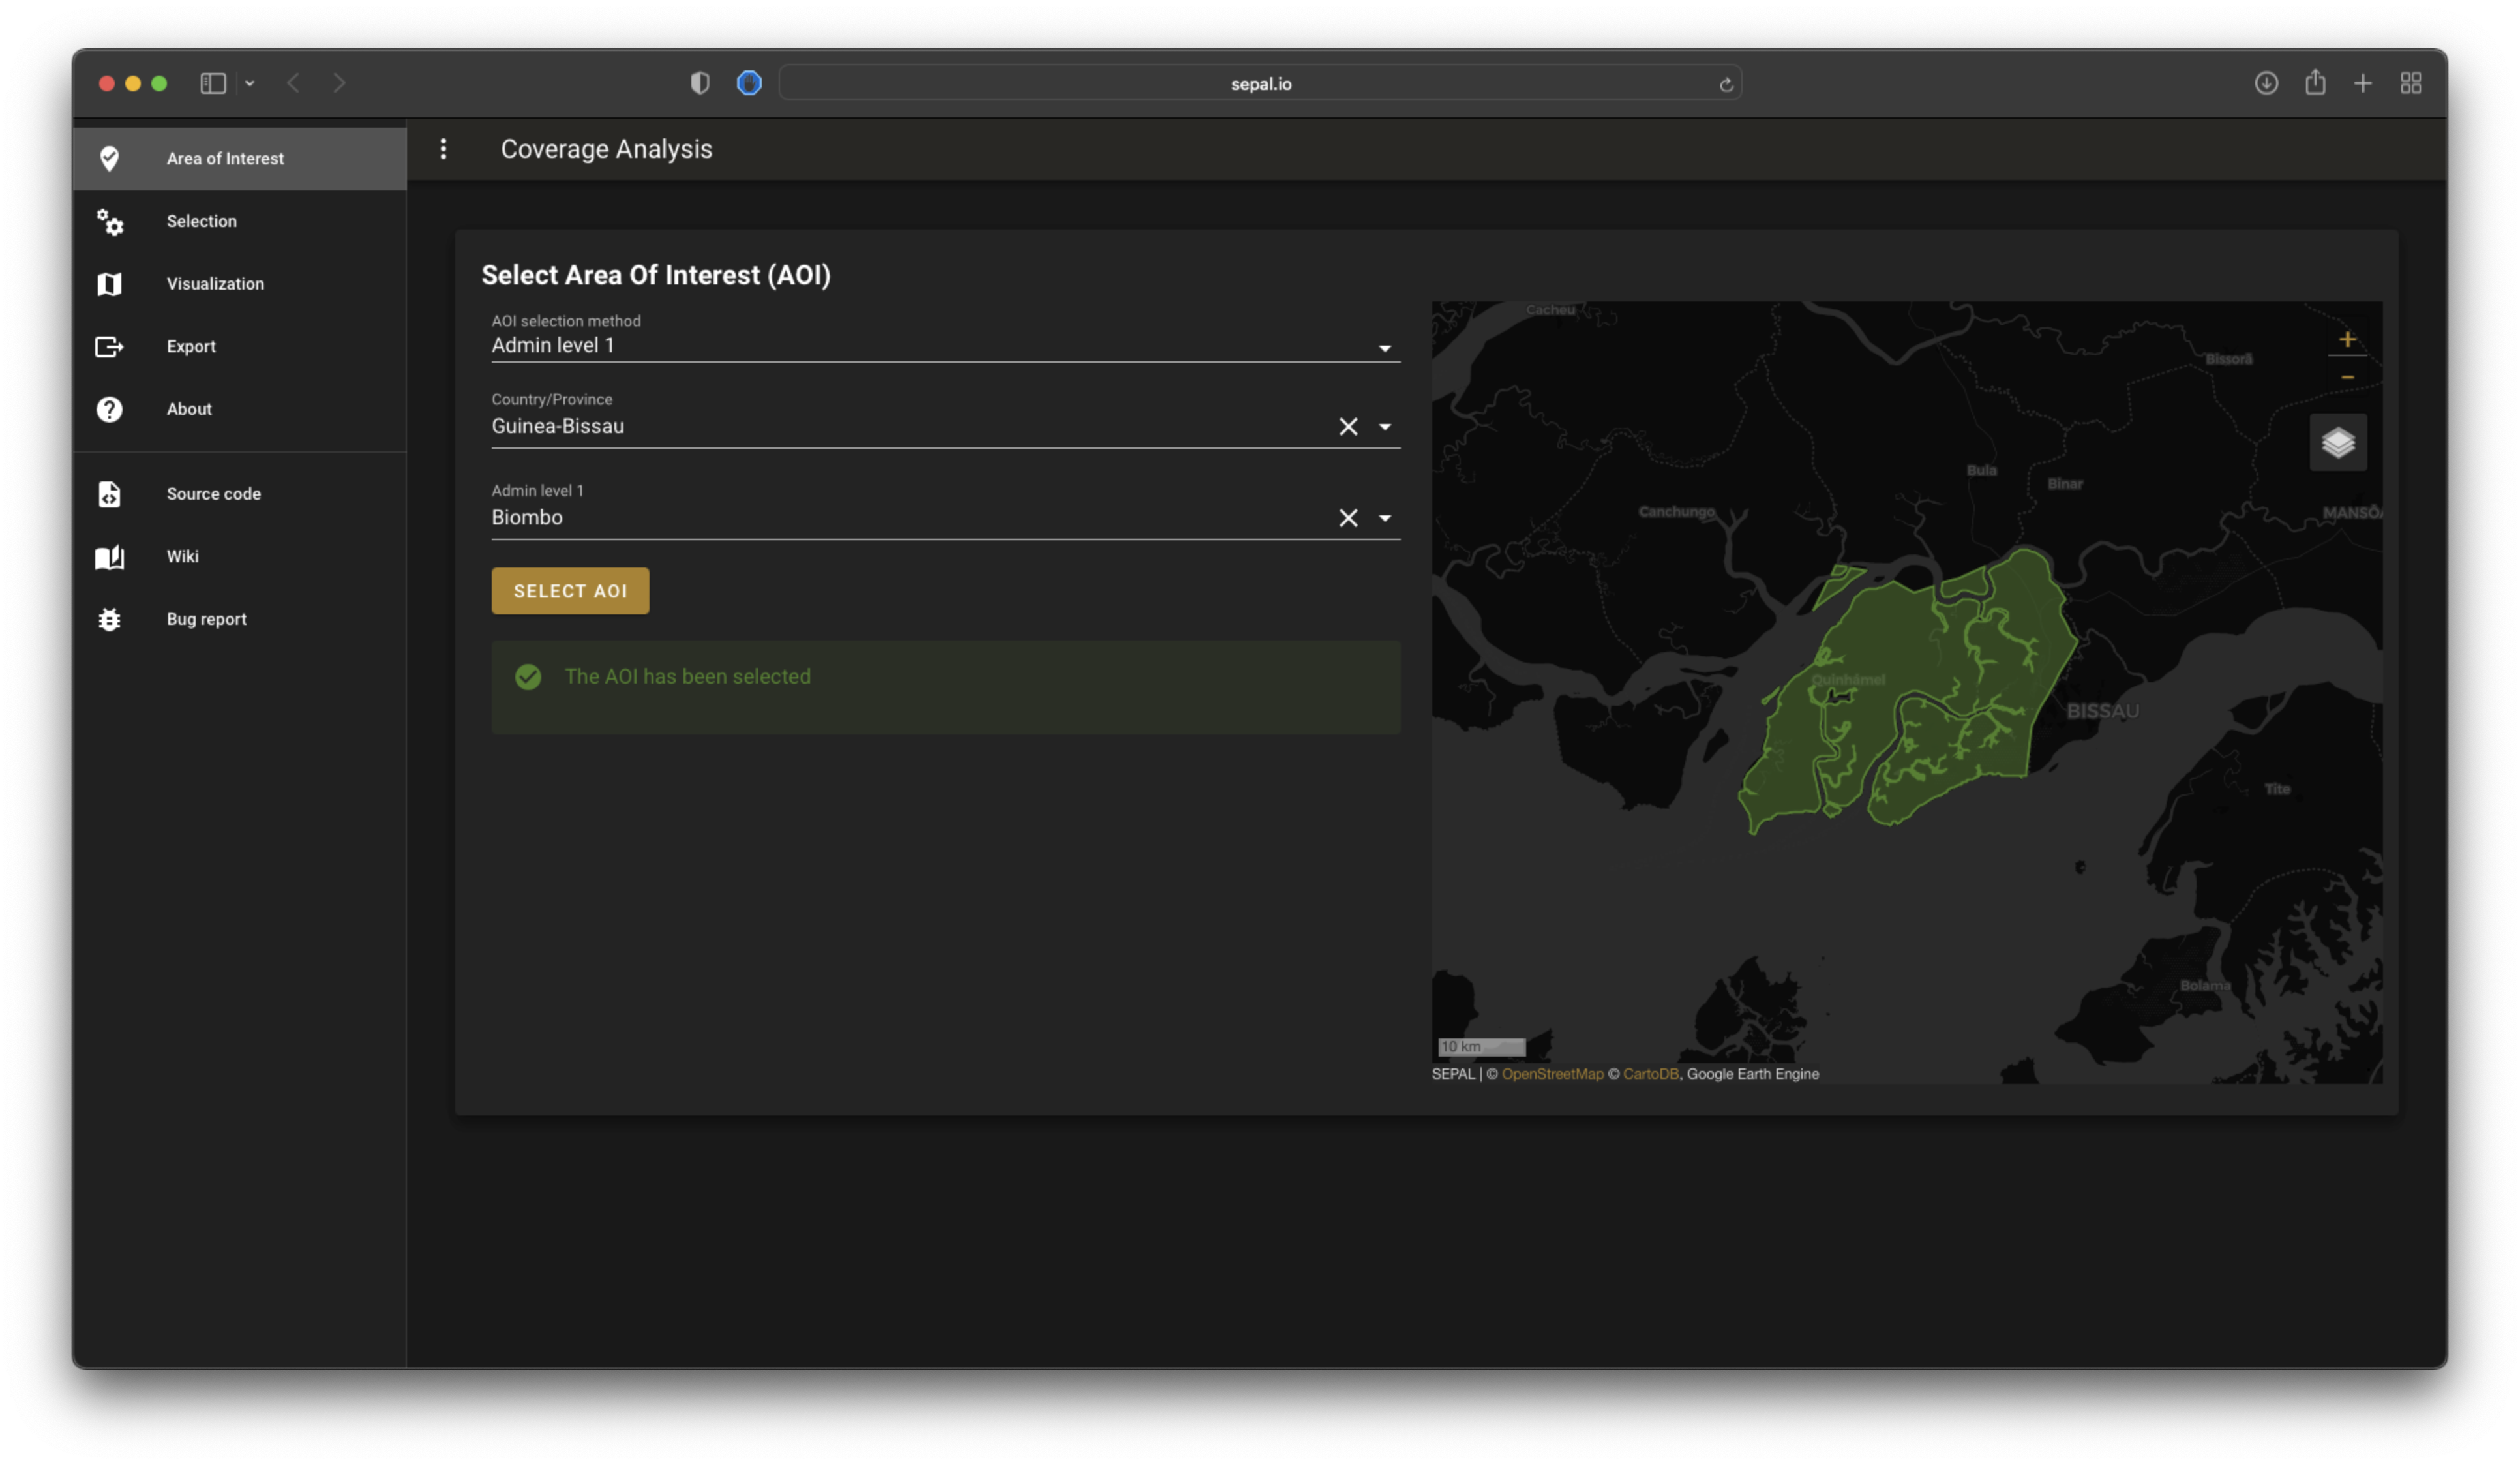
AOI selector#
Note
If a custom AOI from a shape or drawing is selected, you will be able to use it directly (the upload to GEE will be launched in the background).
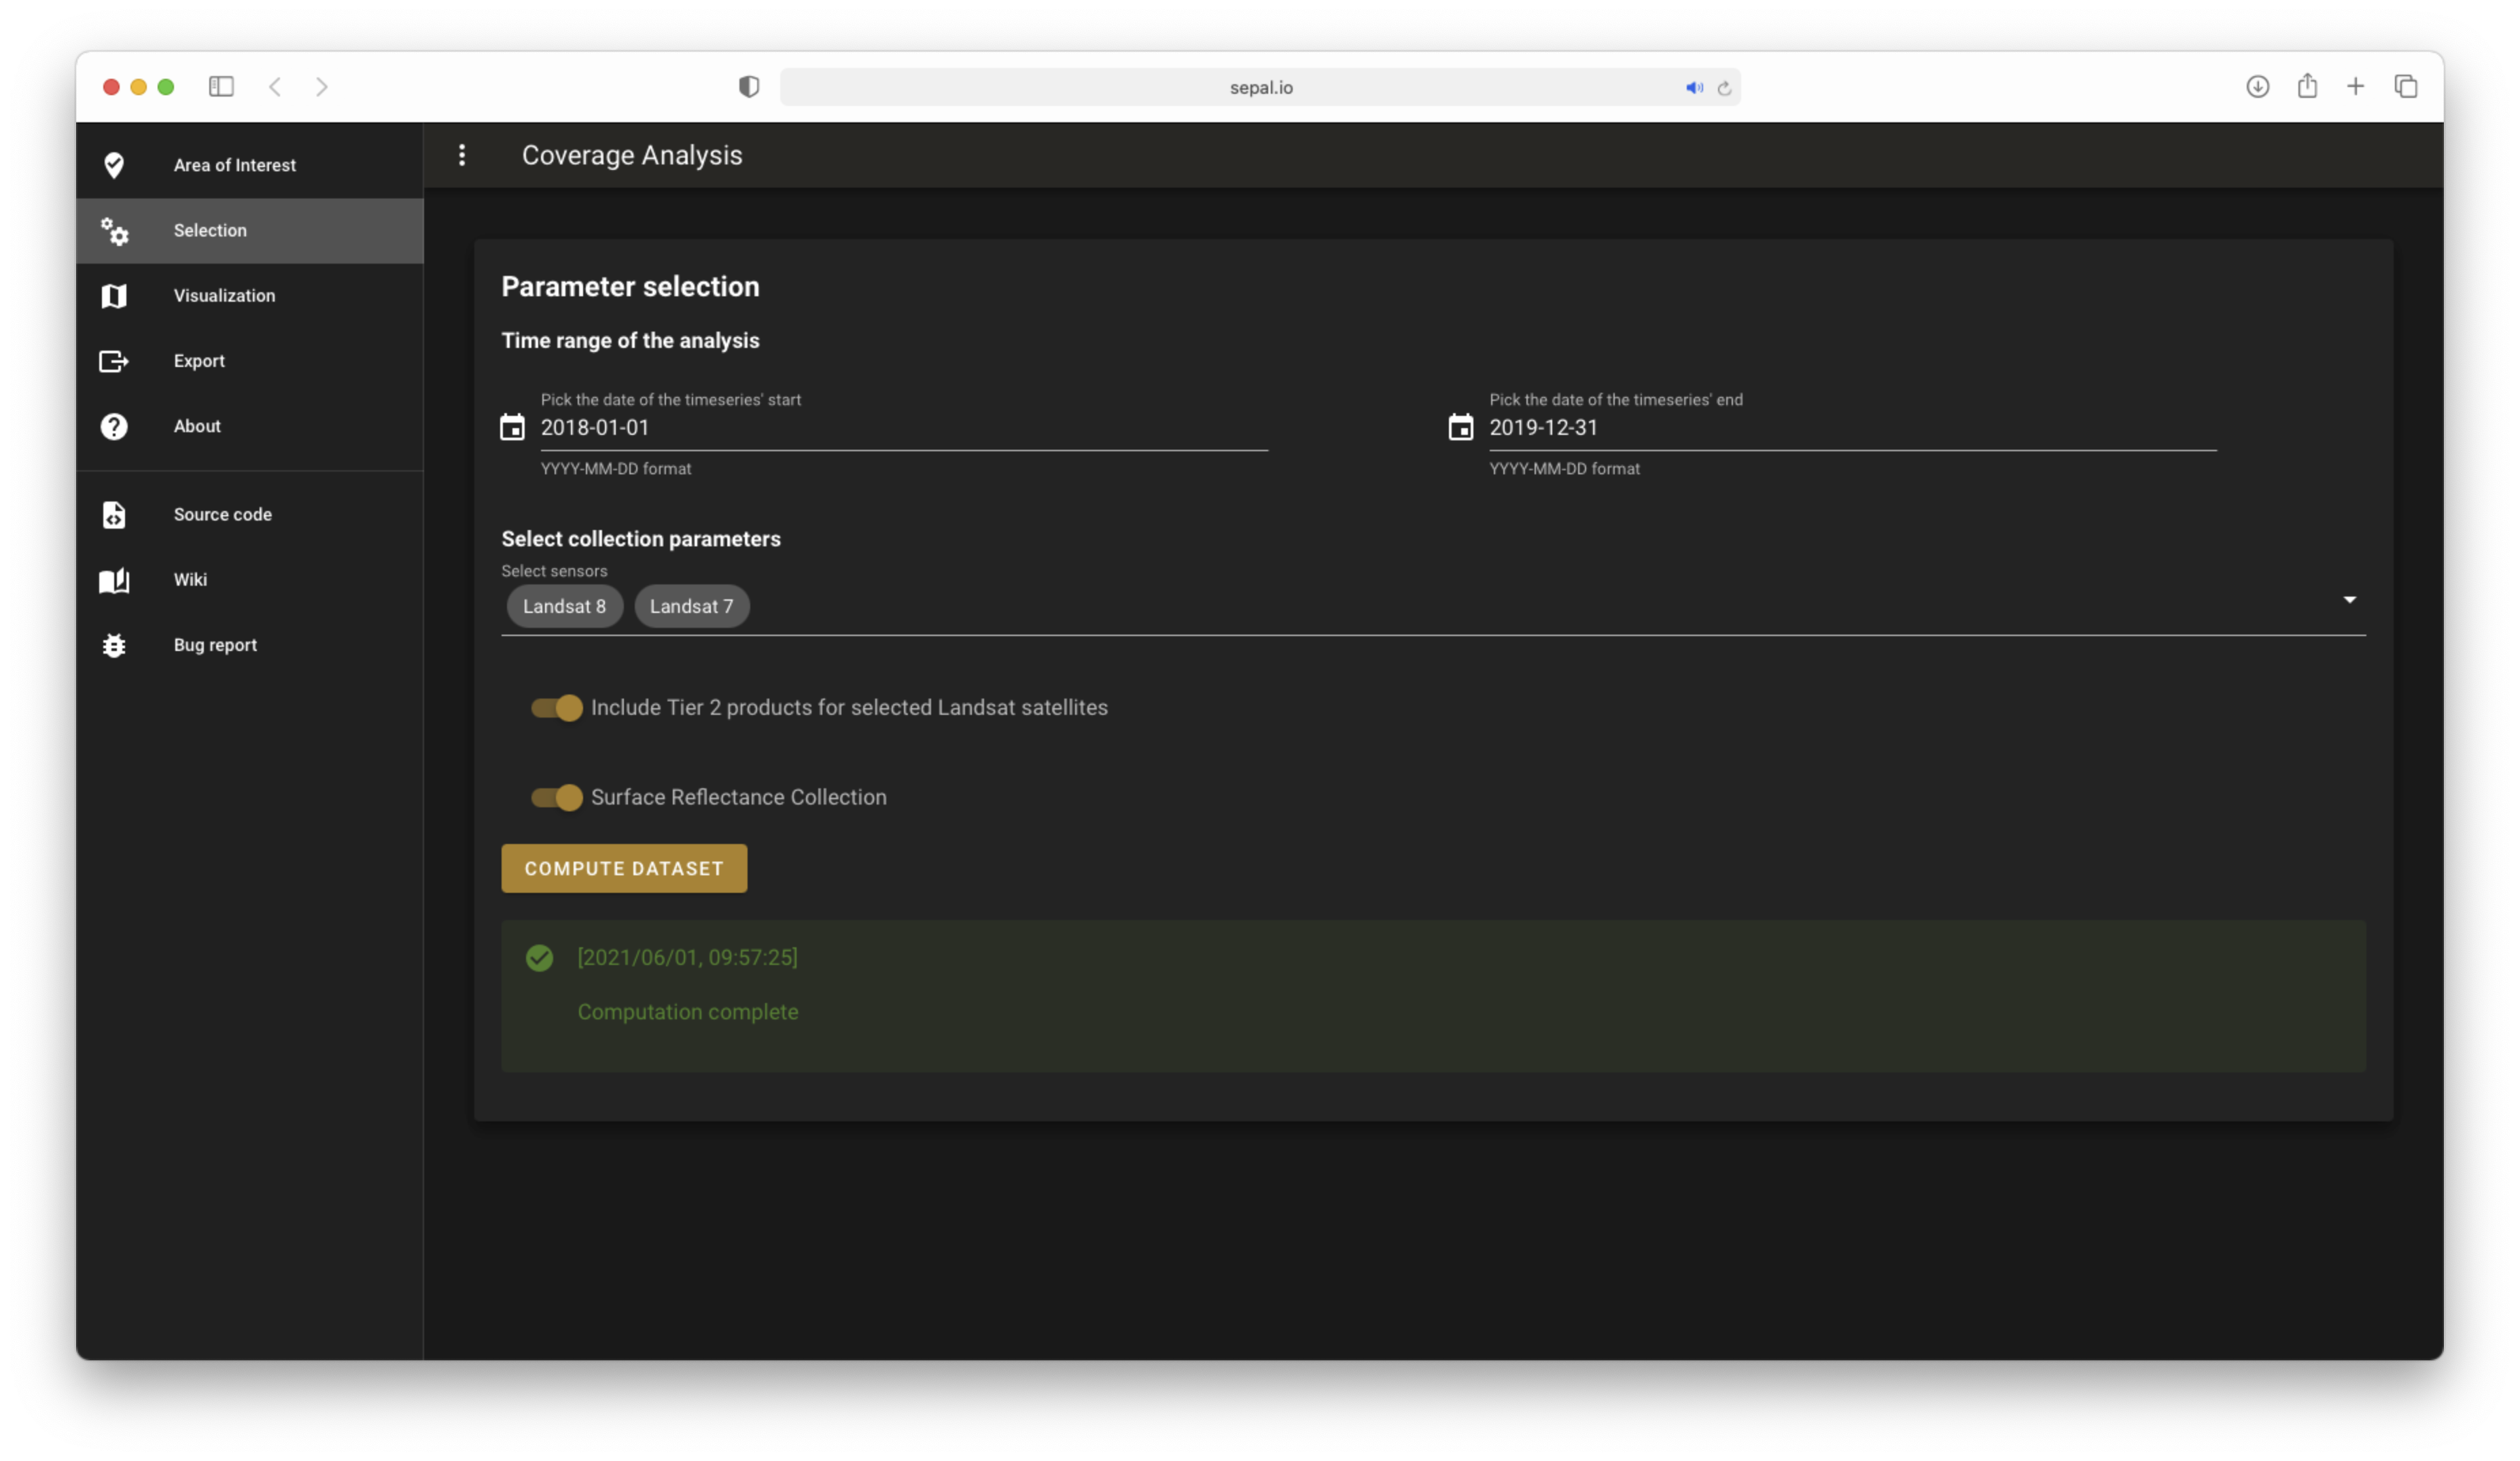
Select dataset parameters#
To perform BFAST pre-analysis, provide the tool with key parameters:
Date range: the start and end dates of your analysis
Sensors: the list of sensors you want to use (Landsat missions and Sentinel-2)
Tier 2: Tier 2 images of the Landsat missions (note: this might lead to incorrect results)
SR: whether to use surface reflectance (SR) images (by default, TOA, referring to top of atmosphere)
Once all parameters have been chosen, select the button.
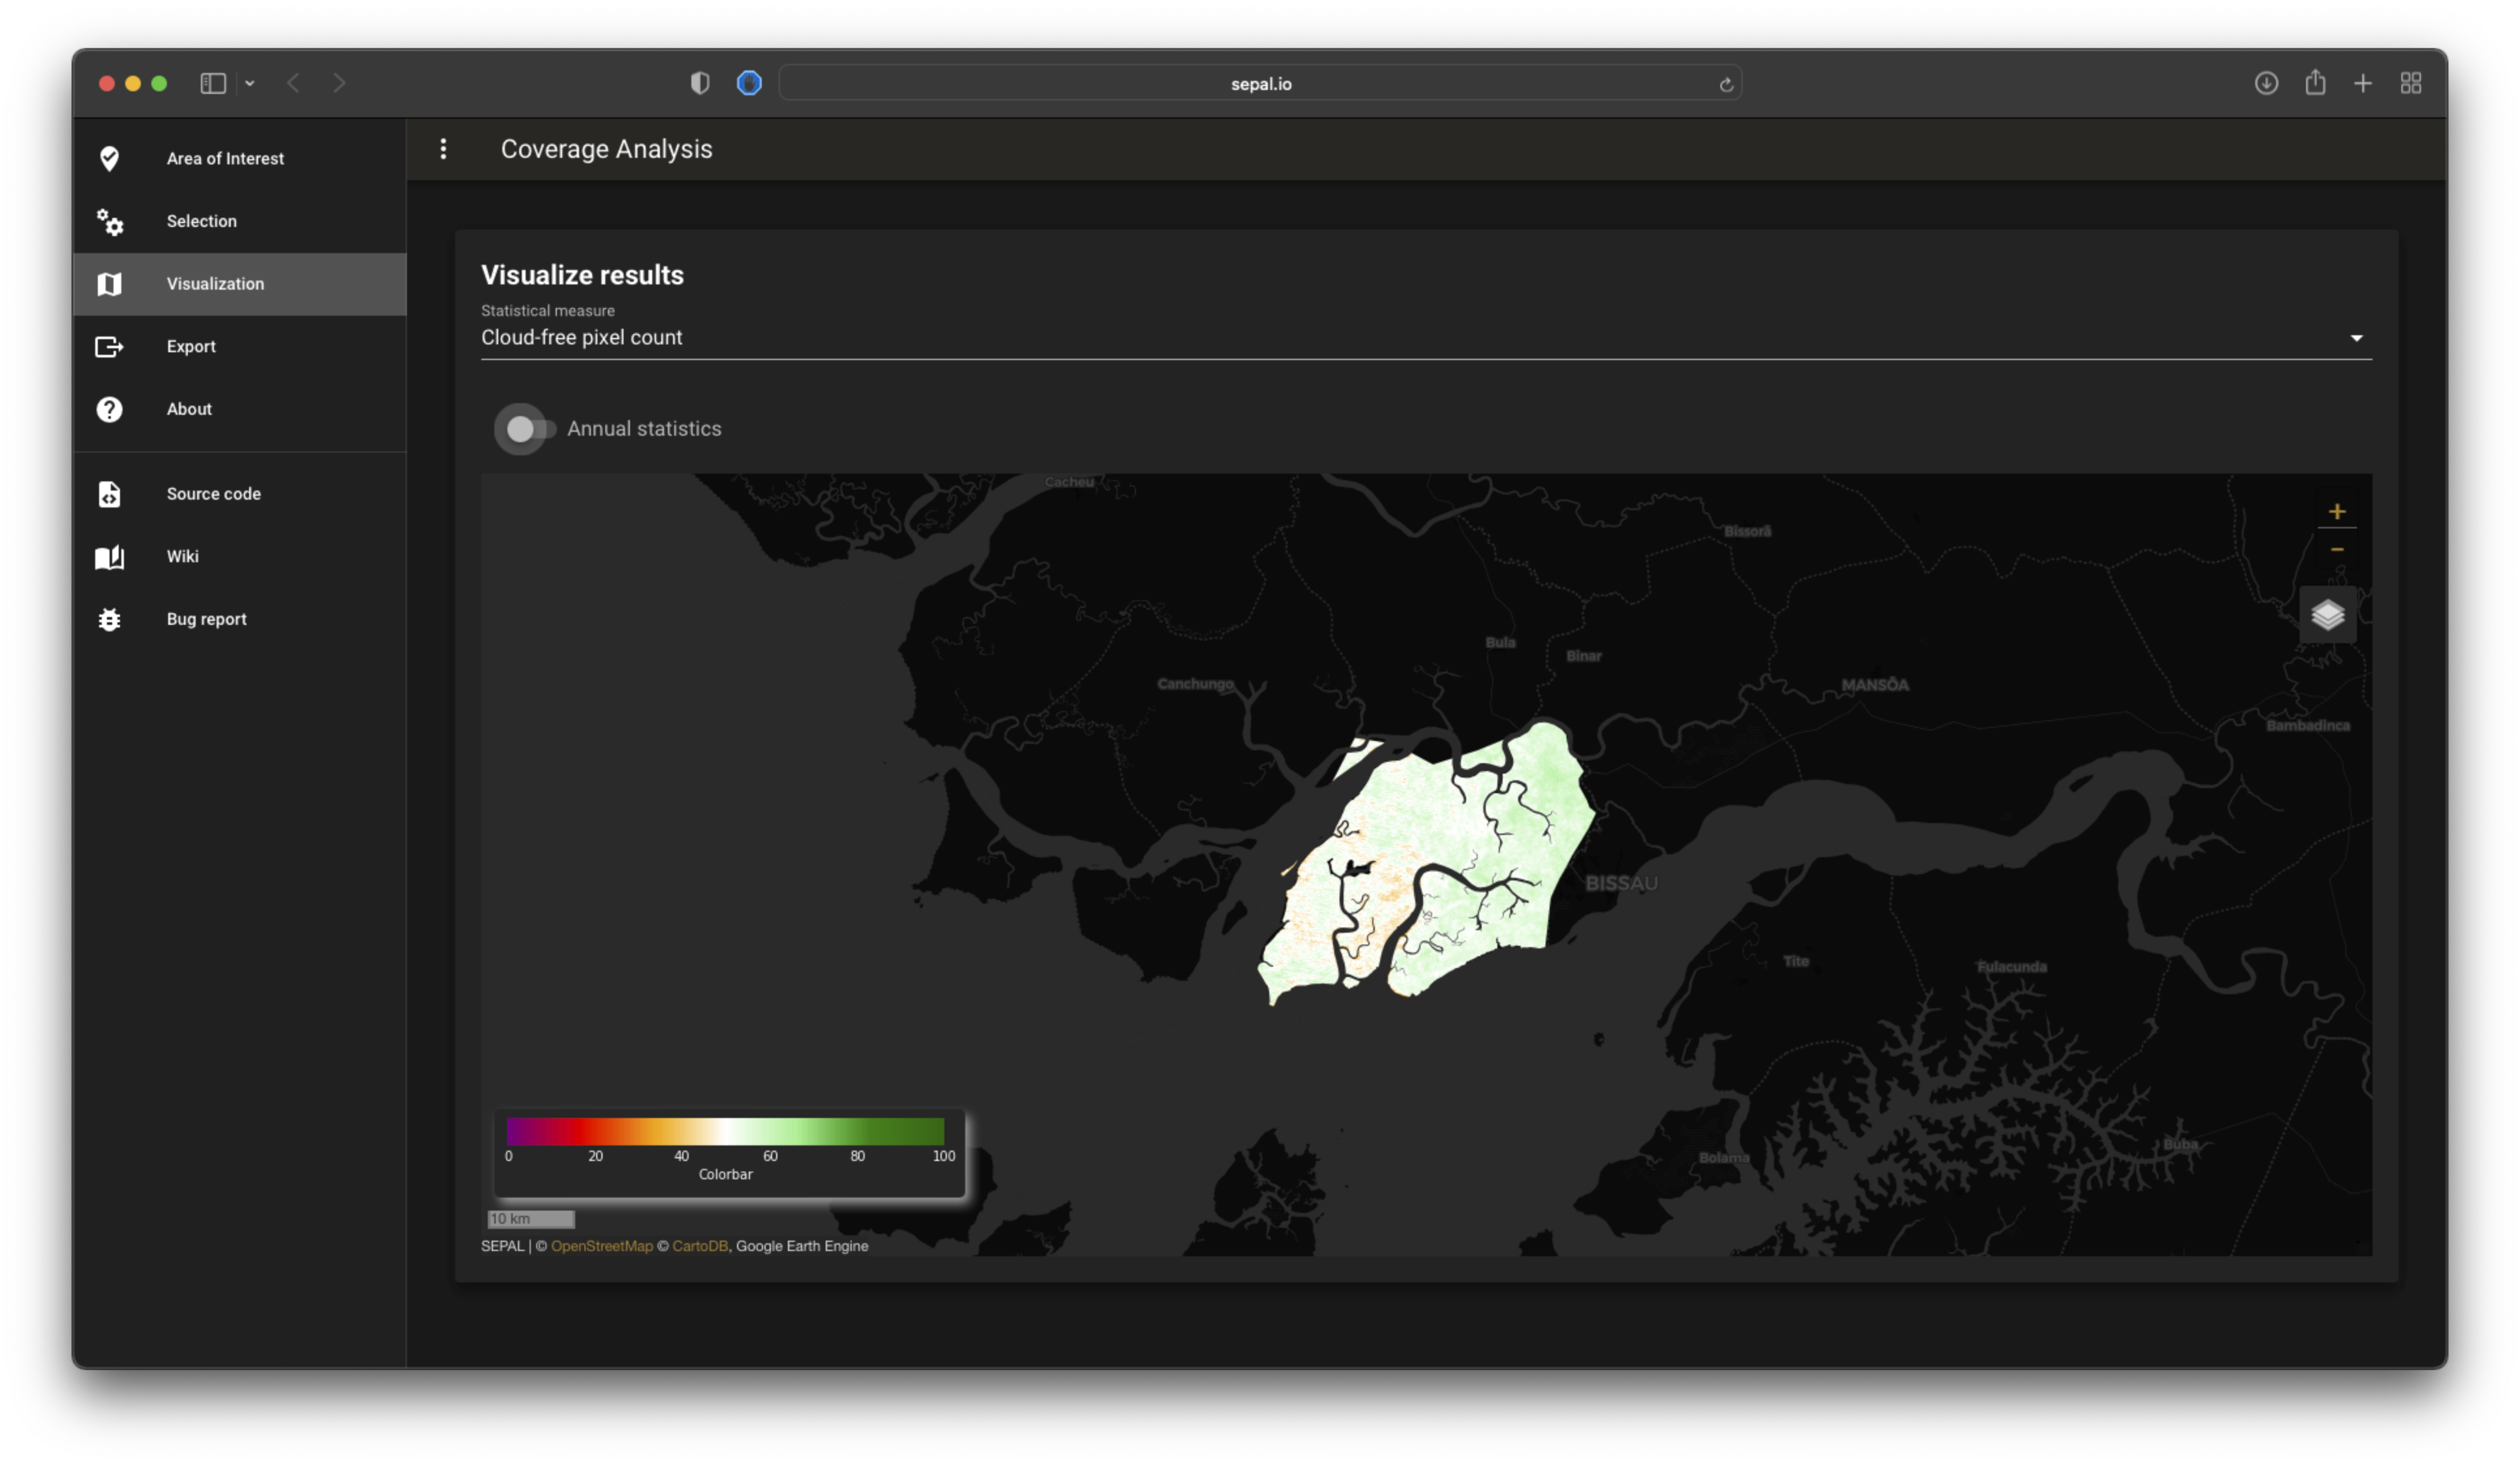
Display dataset#
After selecting your parameters, move to the Visualization tile.
Select one of the statistical measures to display in the following list:
cloud-free pixel count
total pixel count (i.e. scene coverage)
NDVI Median (normalized difference vegetation index median)
NDVI Std. Dev. (normalized difference vegetation index standard deviation)
You can also produce stats on a yearly basis using the provided switch.
Note
The image will be dynamically re-evaluated and recentred upon each change.
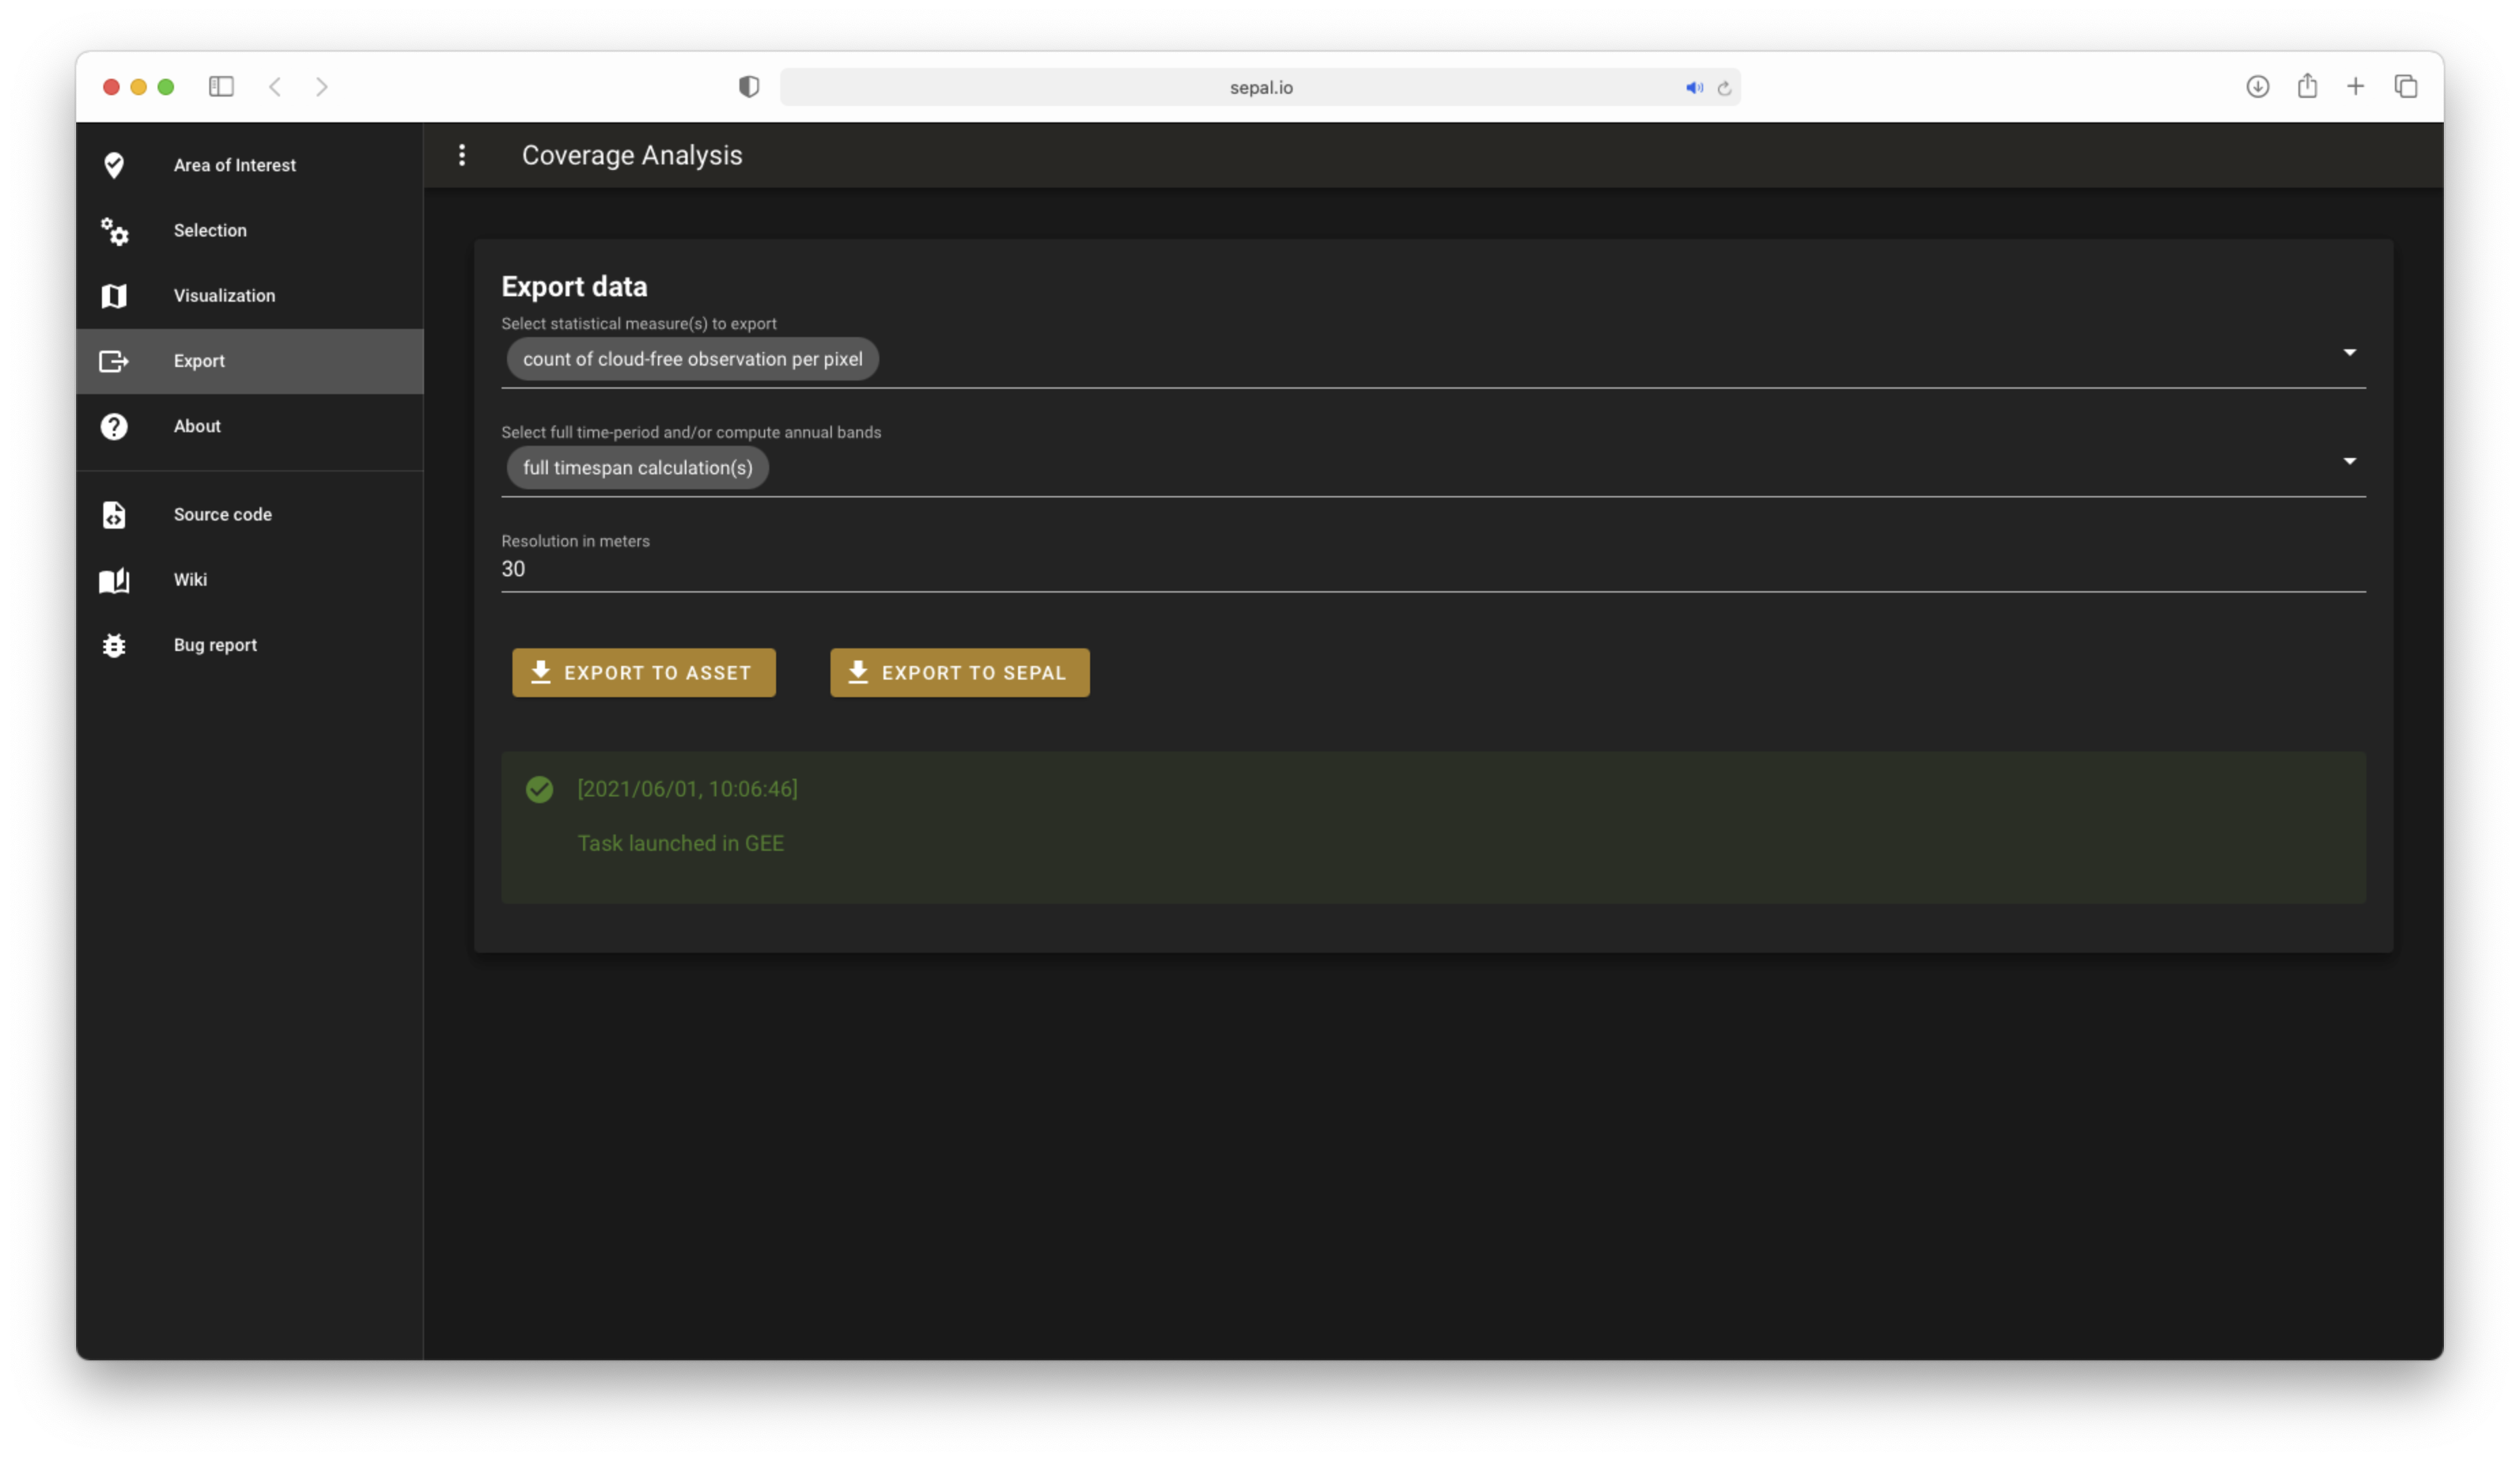
Export dataset#
When you’re satisifed with the displayed information, it can be exported for further use in GIS software or a GEE process. The tool provides two main exportation options:
as an asset (in GEE), or
a .tif file (in SEPAL).
Both use the GEE export system and share the same set of parameters:
Statistical measures to export
count of cloud-free observation per pixel
NDVI’s median of cloud-free observations
NDVI’s std. dev. of cloud-free observations
count for all observations per pixel
Time period
full timespan calculation(s)
annual calculation(s)
Scale: the resolution (in metres) to use in the exported GEE file
Attention
When exporting the image to SEPAL, you cannot quit the application until the download is finished.